Billing & Reports
Usage Report
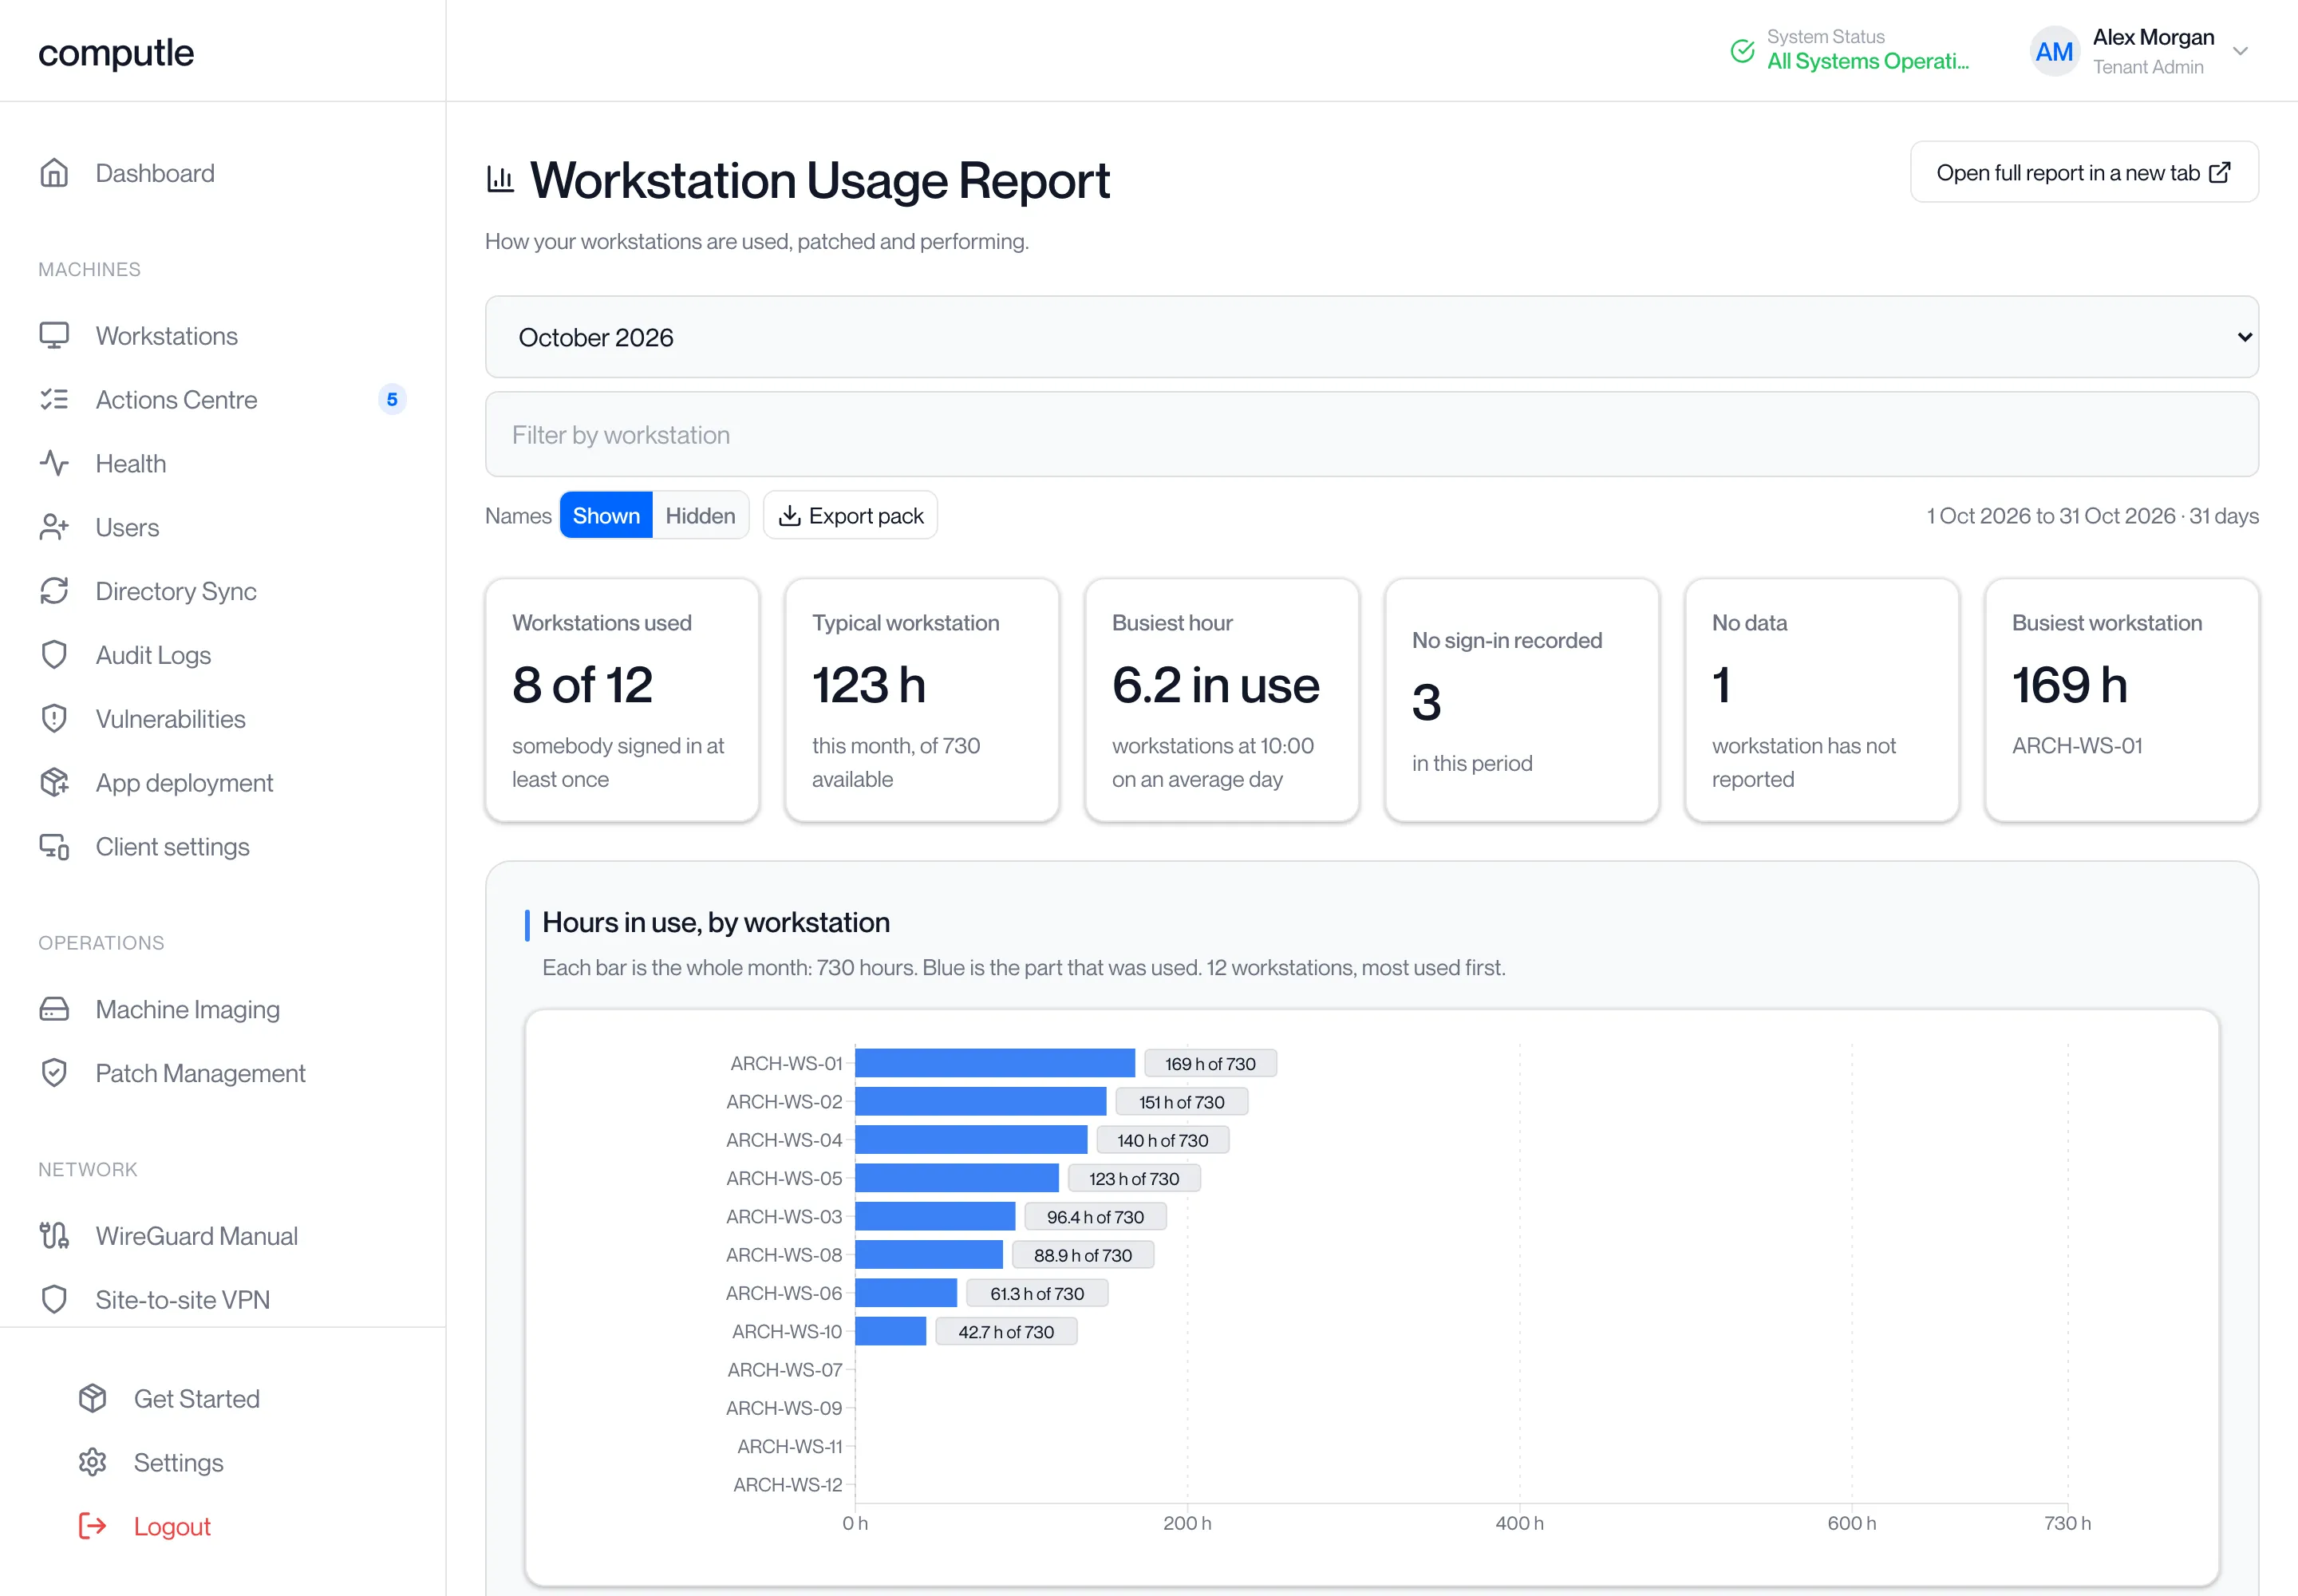
The Workstation Usage Report shows how your workstations are used, patched and performing over a calendar month or a week. Use it to see which workstations sit idle, when your busiest hours are, who has a slow connection, and which workstations could move to a different graphics tier.
Open Usage Report under Monitoring in the portal sidebar. The page needs the Tenant Admin role, and the Monitoring section is shown when Computle has enabled monitoring for your organisation.
What the report measures
Section titled “What the report measures”Every figure on the page is measured against the period on screen. A month is counted as 730 hours and a week as 168, whatever the workstation did, so two months compare without the scale changing.
| Term | Meaning |
|---|---|
| Hours in use | Time somebody was signed in to the workstation. |
| Switched on | Time the workstation was running, whether or not anyone was signed in. |
| No sign-in recorded | The workstation reported in but nobody signed in during the period. |
| No data | The workstation is assigned to someone but has not reported anything. |
| Days used | The number of days in the period with at least one sign-in. |
| Average per day | Hours in use divided by days used. |
Times on the page are UTC.
Choose the period
Section titled “Choose the period”-
Pick a month or a week from the selector at the top left.
Weeks are listed first, then months. A period still running is marked “(month in progress)” in the list. Only months since usage collection began are offered.
-
Wait for “Loading this month…” to clear.
The sections fade while the new period builds.
-
Narrow the page if you need to.
Type in Filter by workstation to match a workstation name or the person assigned to it, or click the No sign-in recorded or No data tile to show only those workstations. Click a bar in the Hours in use chart, or a row in Every workstation, to focus on one workstation. Clear filters removes all of these.
The date range and number of days in the period are shown on the right of the toolbar.
The summary tiles
Section titled “The summary tiles”| Tile | What it shows |
|---|---|
| Workstations used | How many of your workstations somebody signed in to at least once. |
| Typical workstation | The median hours in use, out of the hours available in the period. |
| Busiest hour | How many workstations are in use at the busiest hour of an average day. |
| No sign-in recorded | Workstations that reported in with no sign-in. Click to filter. |
| No data | Workstations that have not reported. Click to filter. |
| Busiest workstation | The workstation with the most hours in use, and its name. |
The sections
Section titled “The sections”| Section | What it shows |
|---|---|
| Hours in use, by workstation | One bar per workstation, most used first. The whole bar is the period; blue is the part that was used. |
| When people are signed in, day by day | A grid with days down and hours across. Darker cells are more minutes signed in. |
| How many workstations are in use through the day | The average number of workstations in use at each hour, and the peak hour. |
| Workstations in use, by month | Every month available: workstations with a sign-in, and hours per workstation per day used. “Not enough complete months yet.” until there are two. |
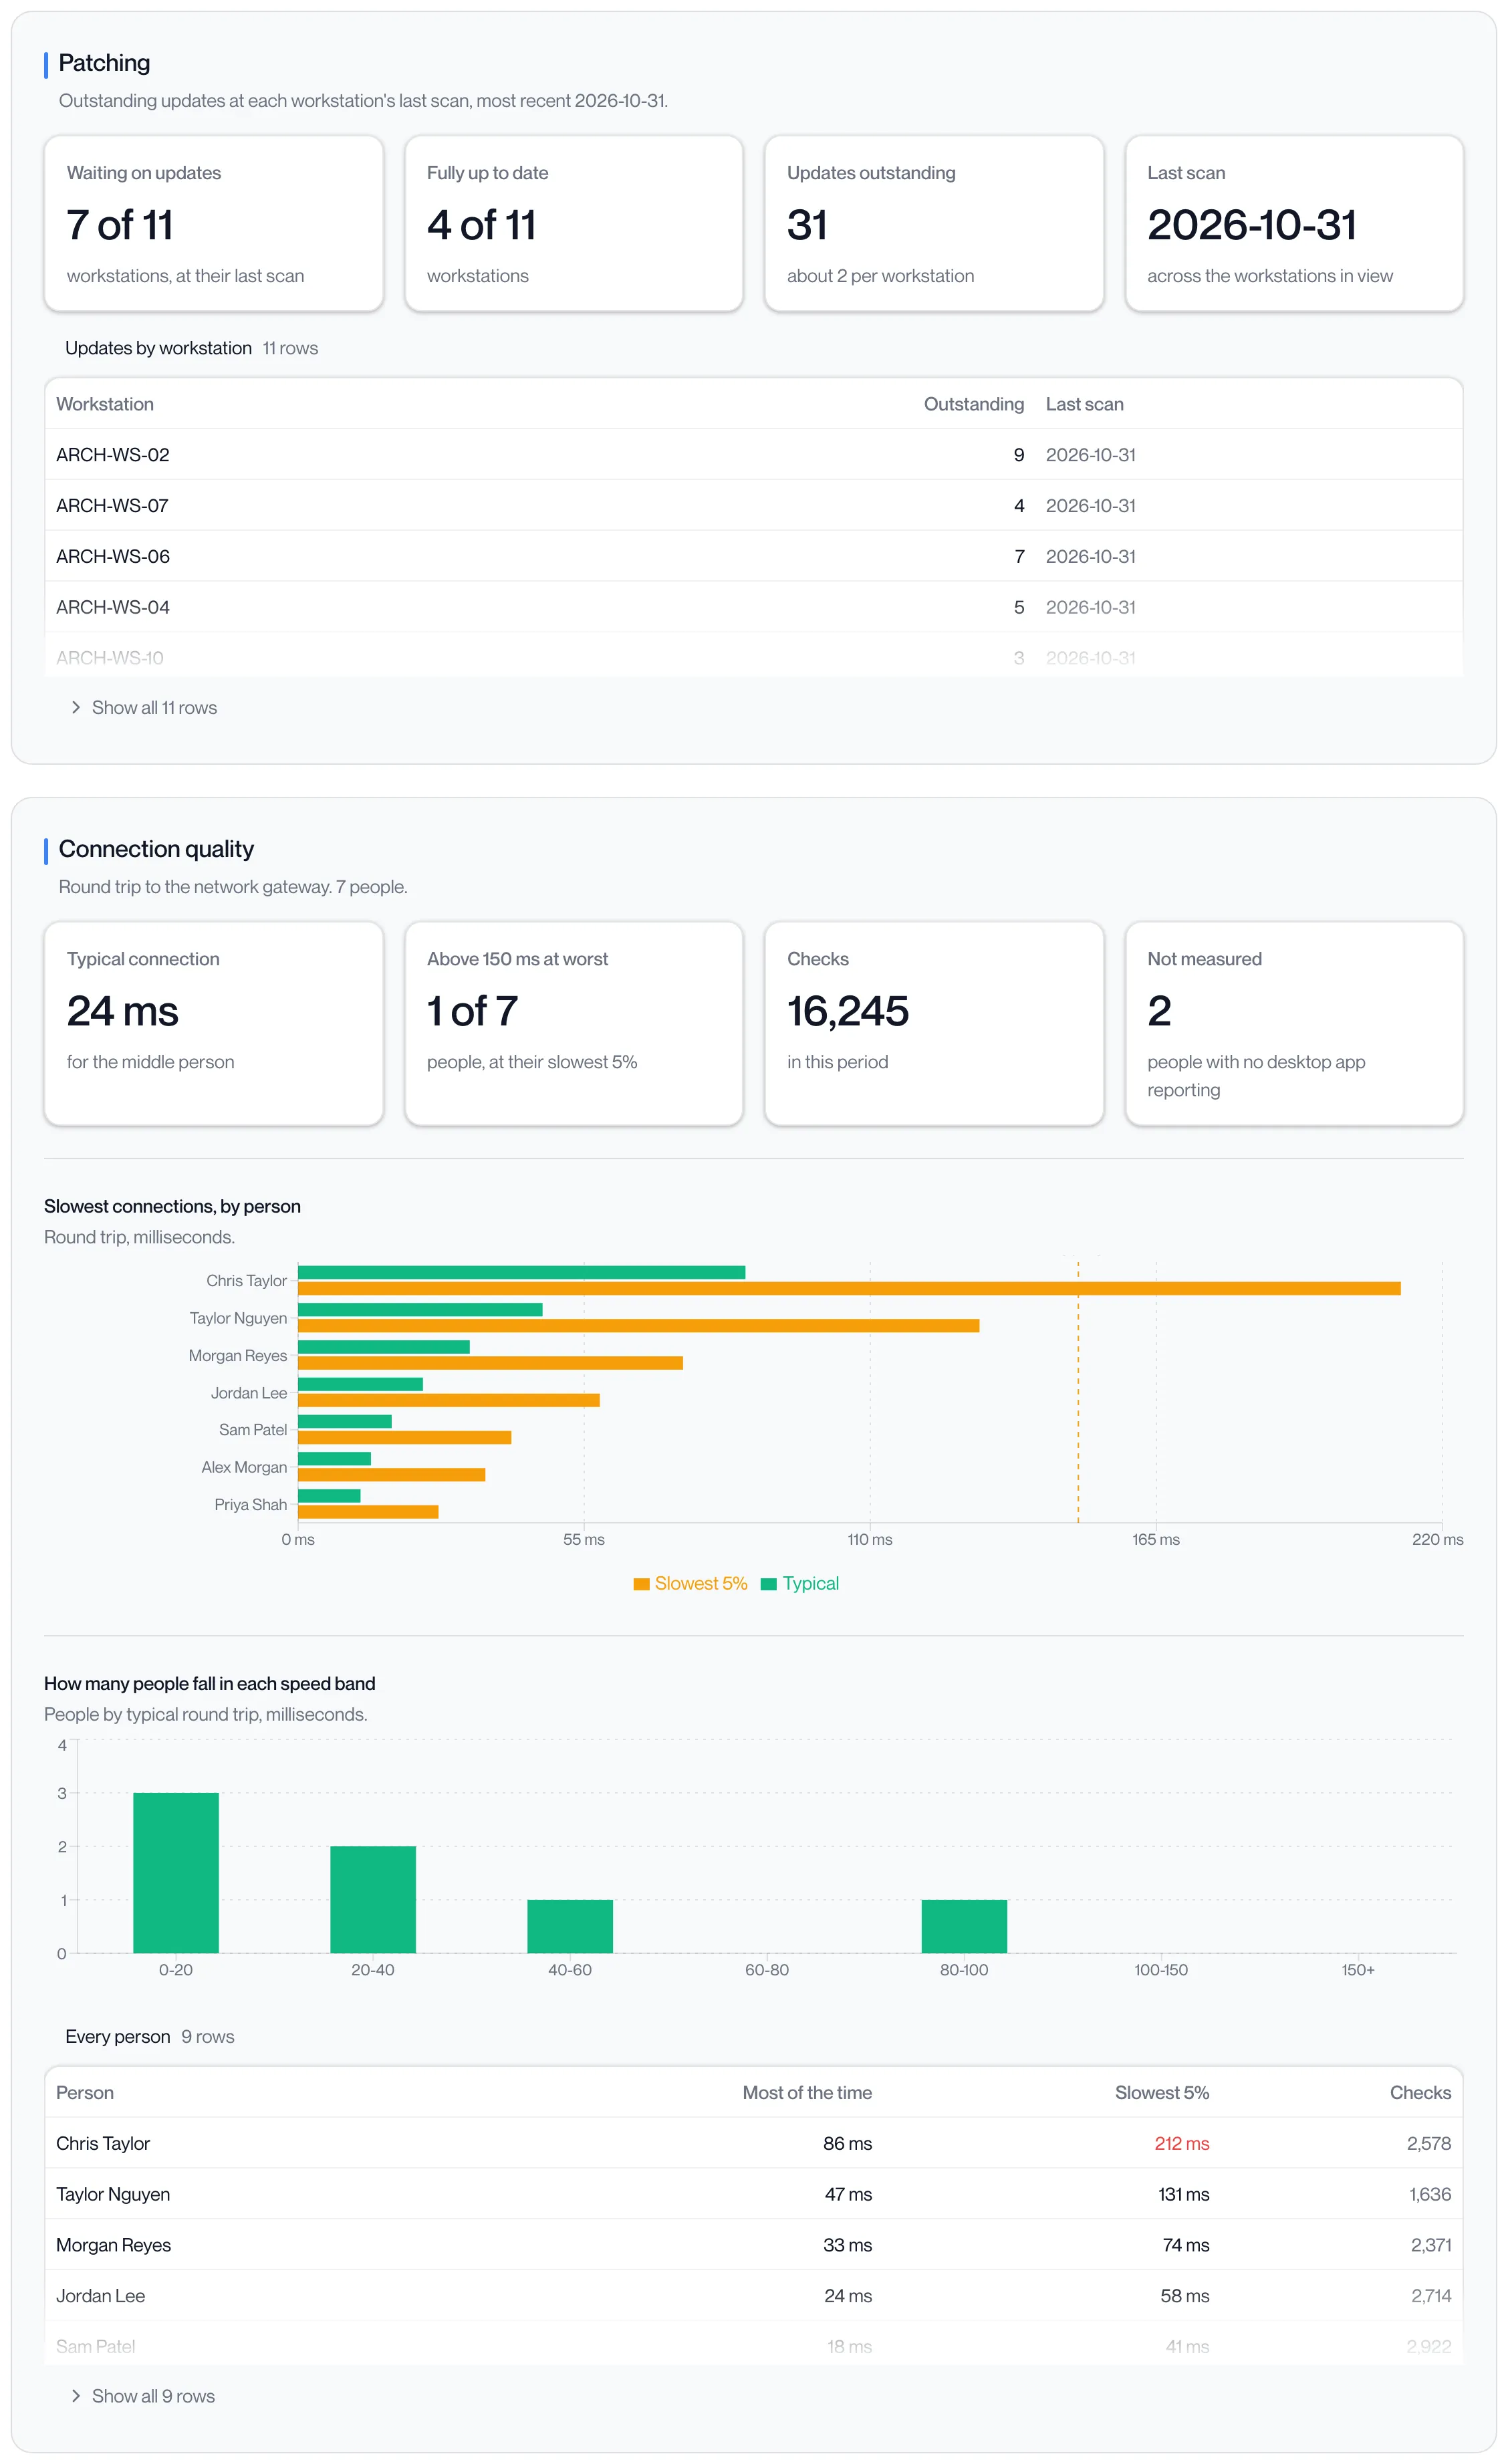
| Patching | Outstanding updates at each workstation’s last scan: how many are waiting, how many are fully up to date, and a table by workstation. “The patch service did not respond.” when the figures could not be read. |
| Connection quality | Round trip from each person’s desktop app to the network gateway: a typical figure, how many people are above 150 ms at their slowest 5%, and a table of every person. People with no desktop app reporting are counted as “Not measured”. |
| Where people work from | Only shown when your organisation signs in through Computle. The share of working days spent in the office, remotely or both, and how many people are never in an office. |
| Restarts after a fault | Blue screens and unclean shutdowns in the period, crash dumps captured, workstations affected, and what the crash dumps have in common. Power interruptions are not listed. |
| Power drawn by the fleet | Wall power including power supply losses over the last 30 days, split by CPU, GPU and other, with a ranking by workstation. Shown when power readings are available. |
| Workstation right-sizing | Graphics load per workstation as five-minute averages across the month, with suggested moves to a lower or higher graphics tier and a table of the graphics cards in the fleet. Shown when graphics readings are available. |
| Restarts | Every workstation’s running time and restarts across the period, longest since a restart first. |
| Every workstation | A table of hours this period, switched on, average per day, days used, days since reboot and power now. Click a row for its time between reboots. |
Tables with more than five rows show the first few and a Show all button.
Hide people’s names
Section titled “Hide people’s names”Click Hidden next to Names to replace every email address on the page with “Person 1”, “Person 2” and so on. The same alias is used for the same person throughout the page and in the export. Click Shown to put the names back.
Export the report
Section titled “Export the report”-
Click Export pack.
The button reads “Building…” and then “Downloaded”. If names are hidden, the pack is masked in the same way.
-
Open the zip file in your downloads.
It contains a
Presentationfolder with the report as slides, aDatafolder with the same figures as a workbook, andData/CSVwith one file per table, plus aREADME.txtthat names the organisation, period and number of workstations.
To print or share the page itself, click Open full report in a new tab. The full-width view carries the same period and the same names setting.
Monthly email
Section titled “Monthly email”Computle can email each administrator a summary of the previous month, headed “Workstation usage report” with the month, with the workstations used, hours signed in, the typical day per workstation and the busiest time of day, and a link that opens this page on that month. It is only sent for a month in which at least one workstation was used.
Messages
Section titled “Messages”| Message | What it means |
|---|---|
| “No workstation sessions have been recorded yet.” | Nothing has been recorded for your organisation. The report appears once people sign in to workstations. |
| “Nothing to show for this selection.” | The filters exclude every workstation. Click Clear filters. |
| “No faults in this period.” | No blue screens or unclean shutdowns were recorded. |
| “The report could not be built.” | The reporting service did not answer. Nothing is wrong with your workstations. Try again shortly. |
| “Session telemetry is not configured on this environment.” | The reporting database is not reachable from the portal. Nothing is wrong with your workstations. |
Related pages
Section titled “Related pages”Questions
Section titled “Questions”Why does a workstation show “No data”?
Section titled “Why does a workstation show “No data”?”It is assigned to someone but has not reported anything in the period. Check that it is running; see Workstations.
Why is last month missing from the list?
Section titled “Why is last month missing from the list?”Only months since usage collection began for your organisation are offered, so month-on-month comparisons are like for like.
Is the busiest workstation the same as the busiest hour?
Section titled “Is the busiest workstation the same as the busiest hour?”No. The busiest workstation has the most hours in use over the period. The busiest hour is the time of day when the most workstations are in use on an average day.