The Session Menu
Picture presets and the Stats tab. Open
Using the App
Press F3 during a session to show live connection figures over your desktop. Press F3 again to hide them. The same figures, with more detail and a latency chart, are on the Stats tab of the session menu.
Use the figures to tell whether a slow or soft picture is your network, your device or the workstation.
The overlay is a small panel in the top-right corner of the screen with a status word, three figures and a detail line. It does not take clicks, so you can keep working with it showing.
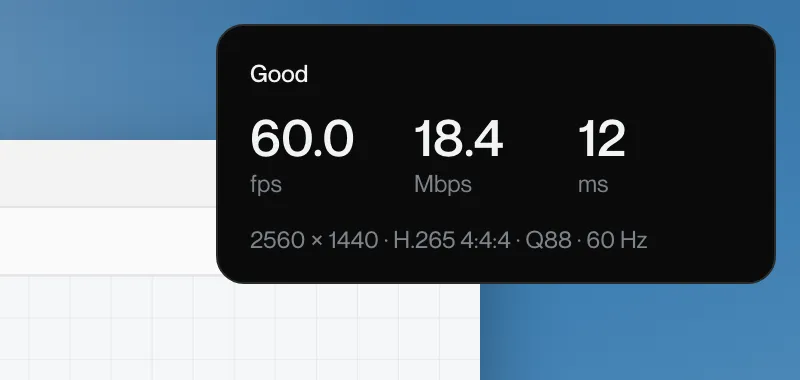
| Figure | Meaning | What to expect |
|---|---|---|
| fps | Frames a second reaching your screen | Close to your frame rate setting: 60 at Auto on a 60 Hz screen, 30 on Smooth |
| Mbps | Video data arriving | Depends on how much of the screen is changing. A still desktop is close to 0; scrolling or video is higher. |
| ms | Round trip between your device and your workstation | Lower is better. A wired office connection to a nearby workstation is often under 20 ms. |
The detail line shows the resolution, the codec and the colour mode, then the quality the workstation is encoding at, for example 3840 × 2160 · H.265 4:4:4 · Q80. On a Mac it also shows the refresh rate.
| Codec text | Meaning |
|---|---|
| H.264 | The widely supported codec, used when the workstation or your device cannot do H.265 |
| H.265 | Smaller for the same quality. Used when both ends support it. |
| 4:2:0 | Standard colour. Fine for most work. |
| 4:4:4 | Full colour, with sharper coloured text and fine lines. Only when both ends support it and Full colour is on. |
| 10-bit, HDR10 | 10-bit colour, and HDR when your screen is in HDR. See HDR and 10-bit colour. |
The status line is white while the session is well. It turns amber or red only when something is measured to be wrong, and the figure that is out of range changes colour with it.
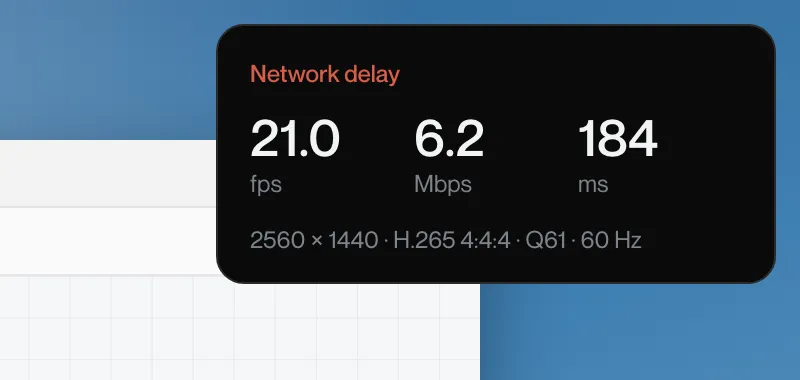
| Status | Meaning | What to do |
|---|---|---|
| Good | The session is running normally. | Nothing. |
| Idle | Nothing on the screen is changing, so little data is being sent. | Nothing. This is normal when the desktop is still. |
| Reduced quality | Remotle has lowered the picture quality to keep up with the connection. | It recovers by itself when the connection allows. If it stays, choose Smooth or close other downloads on your network. |
| Catching up | Remotle is recovering after a delay. | Wait a moment. |
| Network delay | Data is arriving late. | Check the ms figure. On Wi-Fi, move closer to the access point or use a cable. |
| Heavy packet loss | Much of the data is being lost on the network. | Use a cable if you can. Run Diagnostics if it continues. |
| Limited bandwidth | Mac only. The connection cannot carry the full picture. | Choose Smooth, or check what else is using the connection. |
| Waiting for the host | Your workstation has not sent a new picture yet. | Wait. If the status stays, the workstation may be busy or restarting. |
| Not connected | The session is not connected. | Remotle reconnects by itself. See Reconnecting. |
For the full set of figures, open the session menu (F2) and click Stats. It updates every second and keeps a chart of latency for the whole session.
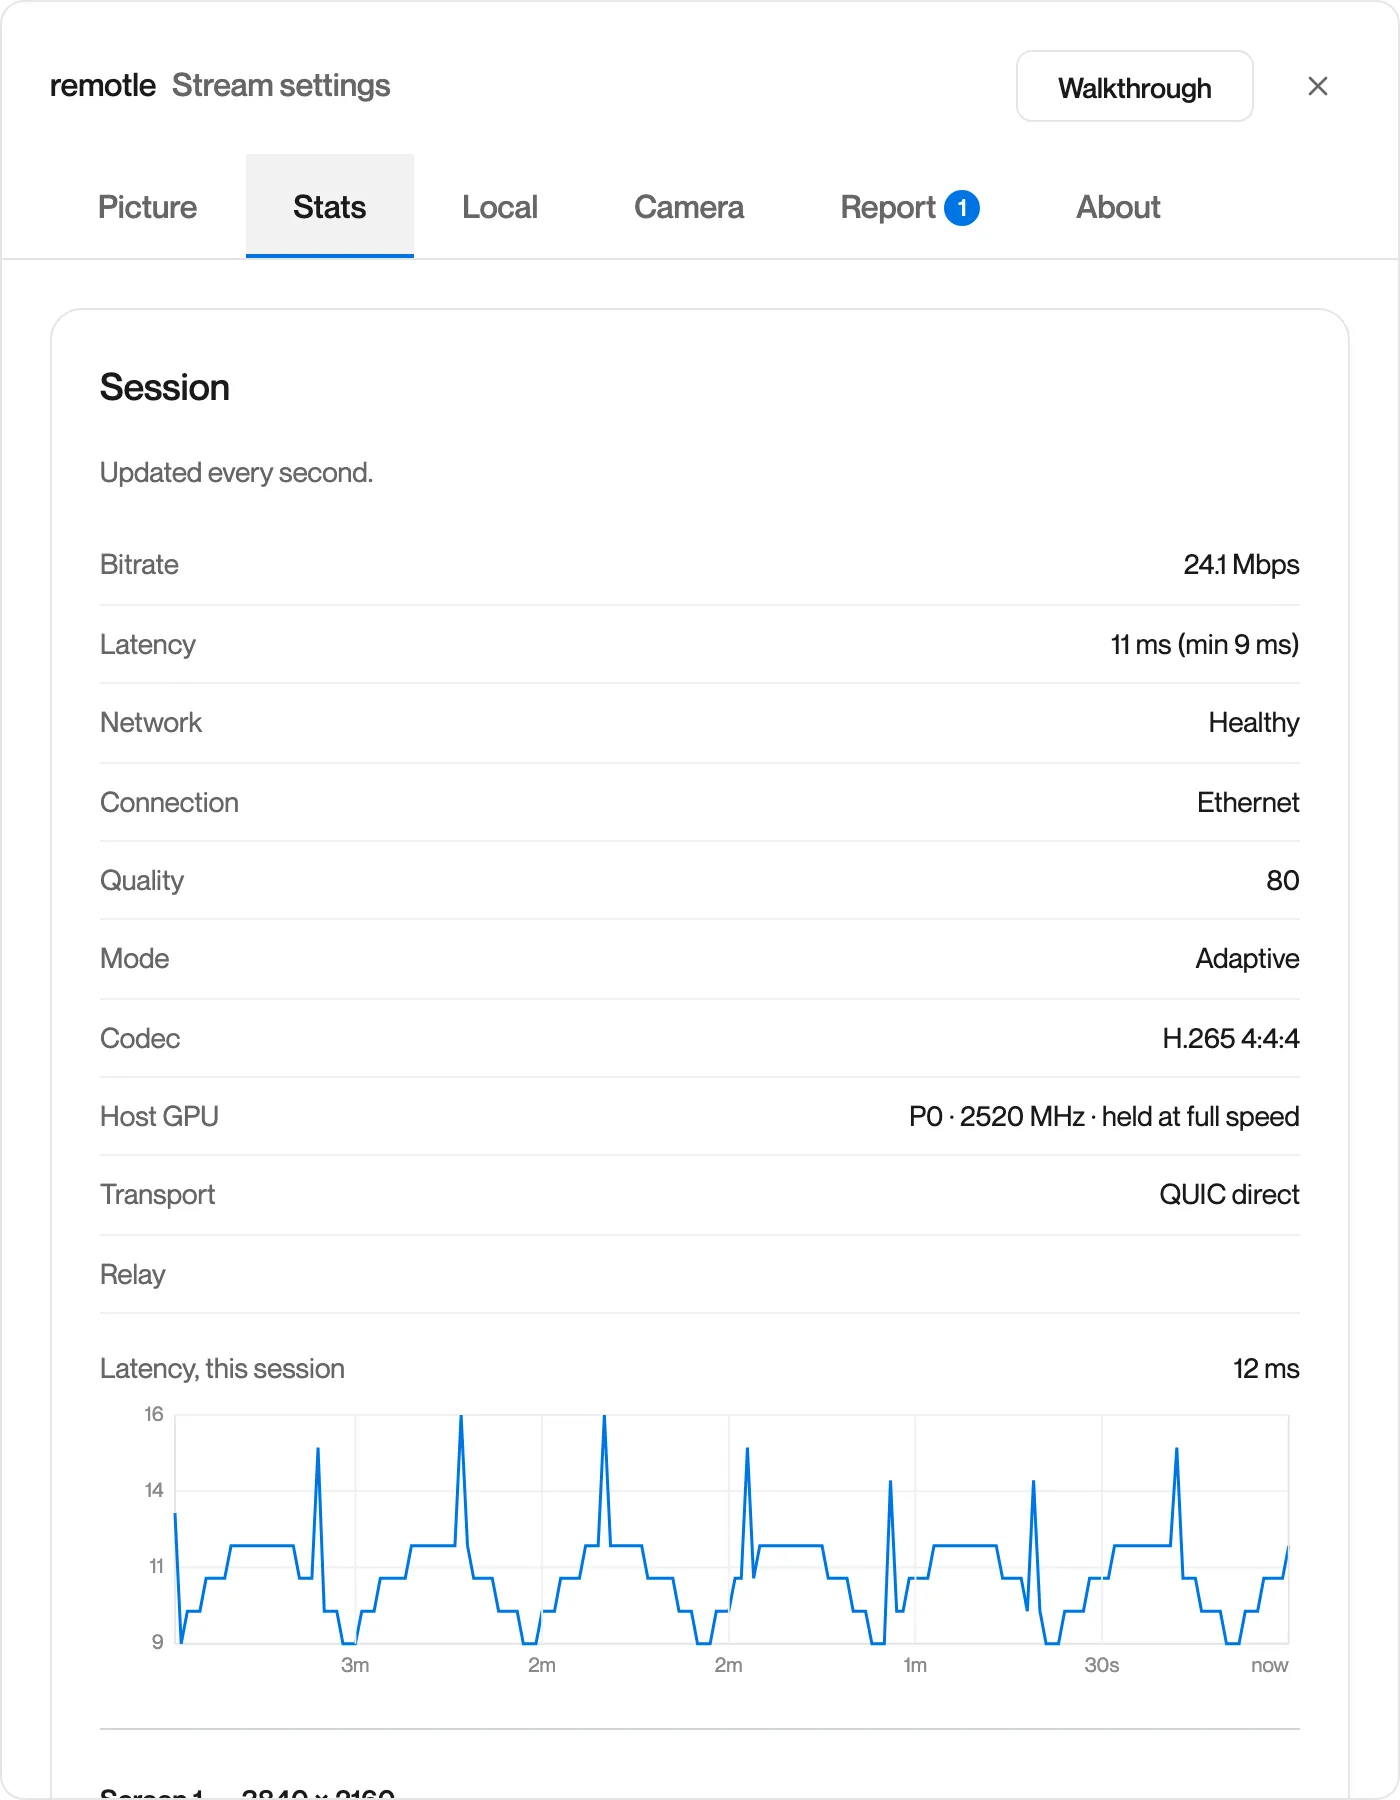
| Row | Meaning |
|---|---|
| Bitrate | Video data arriving, in Mbps |
| Latency | Round trip in ms, with the lowest seen this session |
| Network | Healthy, Strained or Congested, with the share of the session that was degraded |
| Connection | Ethernet, Wi-Fi with its details, or Cellular |
| Quality | The quality the workstation is encoding at, 1 to 100 |
| Mode | Adaptive, Quality or Responsive |
| Codec | As on the overlay |
| Host GPU | The workstation’s graphics card clock and whether Remotle is holding it at full speed |
| Transport | How the video travels, for example QUIC direct |
| Relay | The relay in use, or blank for a direct connection |
| Screen n | Per screen: size, frames Received, Decoded and Drawn each second, and bitrate |
If Received is high but Drawn is low on one screen, that device is struggling to decode or draw. The cause is the device. If Received itself is low while the workstation frame rate is high, frames are being lost on the way.
Press Ctrl+F3 to copy the figures as text.
Press Command+F3 while the figures are showing to copy them as text.
Press Ctrl+F3 to copy the figures as text.
Open the menu pill, turn on Statistics, then choose Copy statistics.
Paste them into a message to support, or into a problem report.
Not necessarily. On a still desktop Remotle sends fewer frames because nothing has changed, and the status reads Idle. Move a window and the figure rises. If it stays low while the screen is moving, read the status word.
The bitrate follows how much of the screen changes. Scrolling a document or playing video sends more data than typing. A steady figure near 0 on a still desktop is normal.
It depends on the distance between you and your workstation. The Latency row on the Stats tab shows the lowest figure seen this session, so compare the current figure with that. A current figure far above the minimum points at congestion on your network.
The quality the workstation is encoding at, on a scale of 1 to 100. The Quality control on the Picture tab sets the target: Low is 40, Medium 65, High 80 and Maximum 100. In Adaptive mode the figure can fall below the target when the connection is under pressure.