The Session Menu
Session Menu: Stats
Live figures for the session, updated every second, with a chart of latency for the whole session. With more than one screen, each screen has its own block of figures.
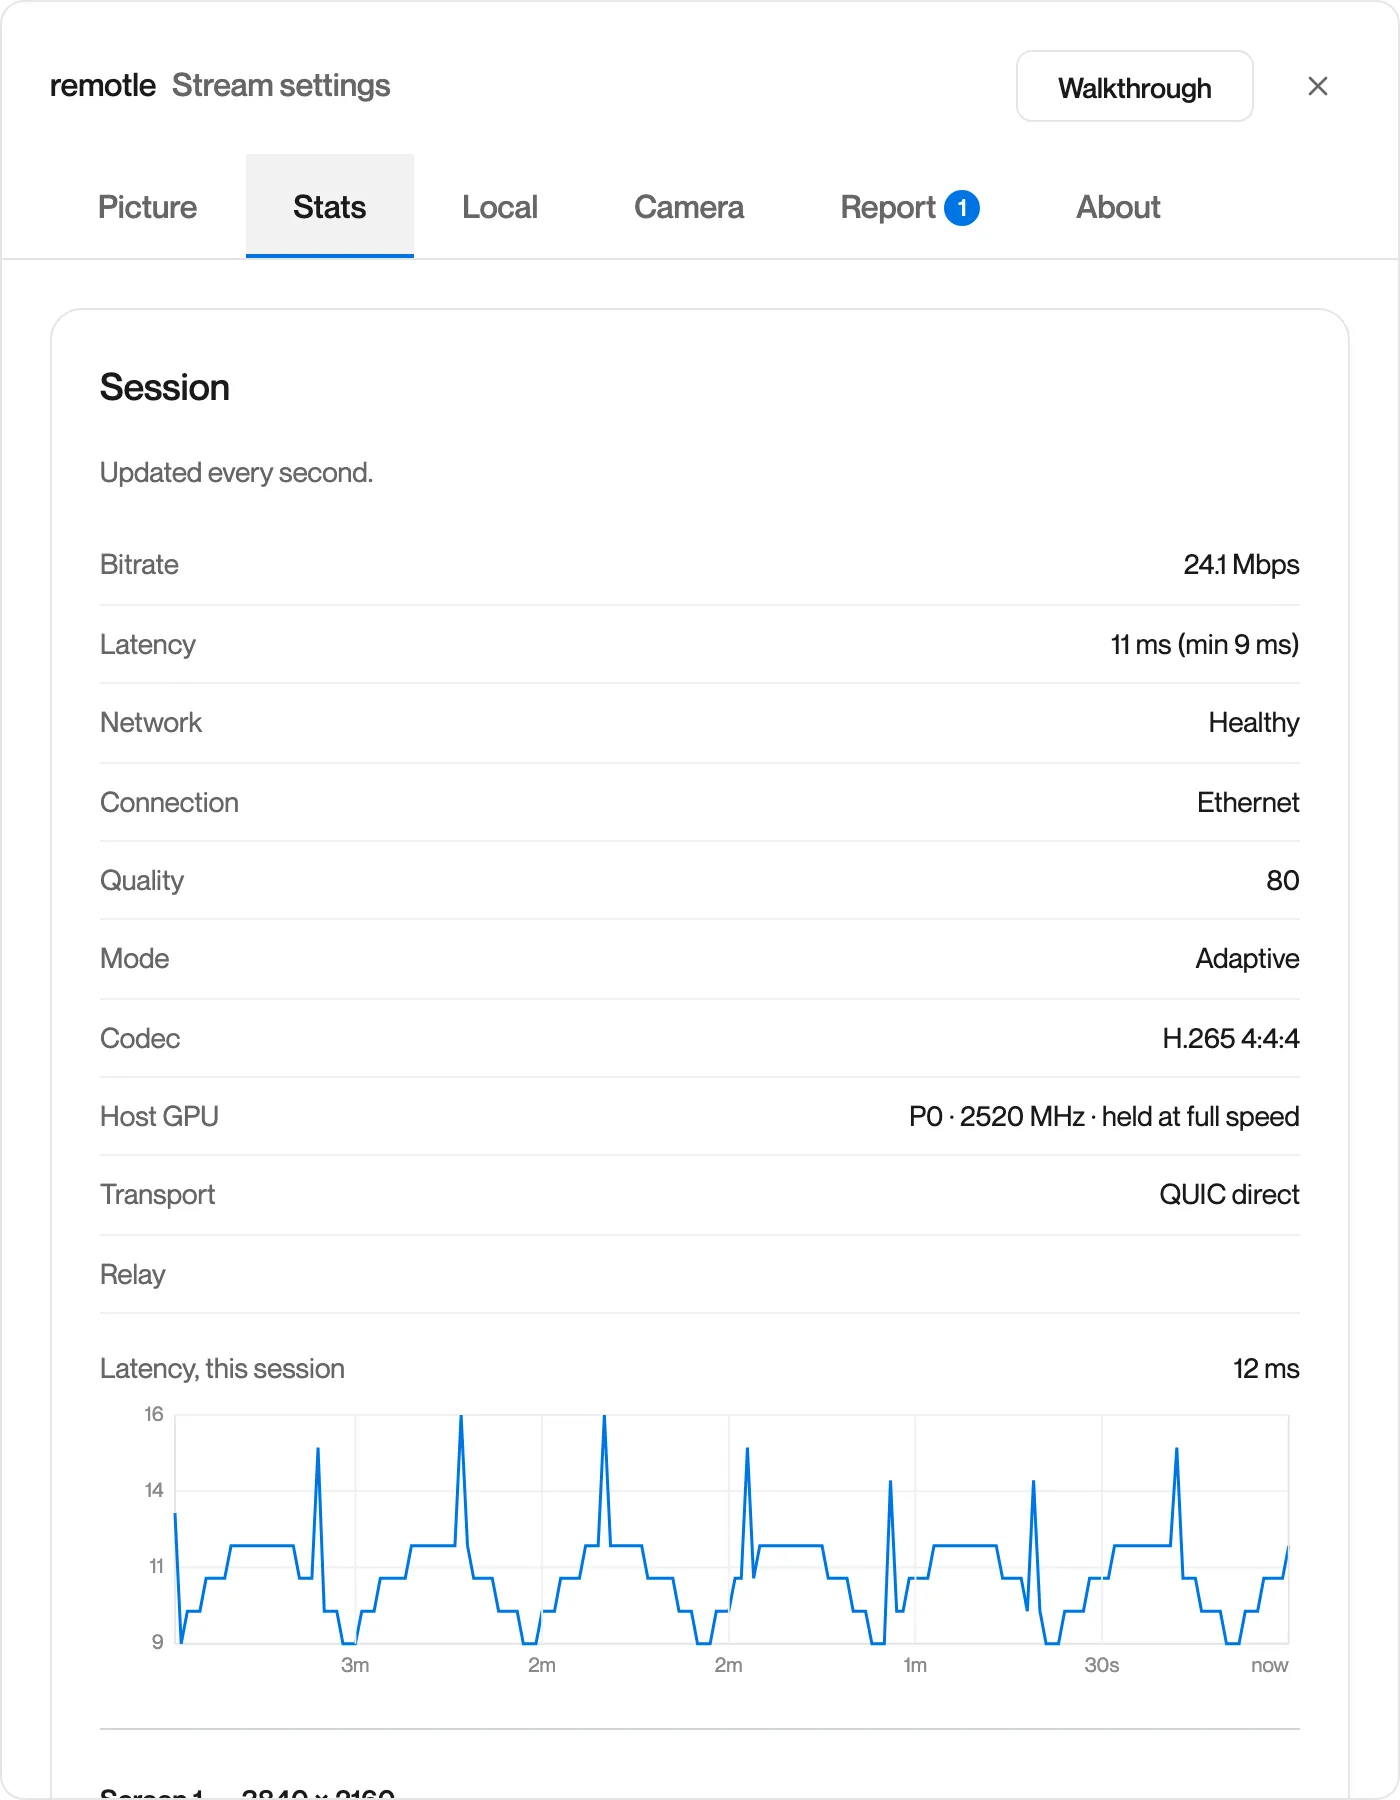
| Row | Meaning |
|---|---|
| Bitrate | Video data arriving, in Mbps |
| Latency | Round trip between your device and your workstation, in ms, with the lowest seen this session |
| Network | Healthy, Strained or Congested, and the share of the session that was degraded |
| Connection | How this device is on the network: Ethernet, Wi-Fi with its details, or Cellular |
| Quality | The quality the workstation is encoding at, from 1 to 100 |
| Mode | The mode in use |
| Codec | H.264 or H.265, and the colour mode, for example H.265 4:4:4 or H.265 4:2:0 HDR10 |
| Host GPU | The workstation’s graphics card clock, and whether Remotle is holding it at full speed |
| Transport | How the video travels, for example QUIC direct |
| Relay | The relay in use, or blank for a direct connection |
| Latency, this session | A chart of latency since you connected, up to the last 10 minutes |
| Screen n | Per screen: its size, frames Received, Decoded and Drawn each second, and its bitrate |
The Host GPU row reads “held at full speed” while you work. After five minutes without input it reads “slowed, no recent input”. A workstation without an NVIDIA graphics card shows No NVIDIA GPU.
See also Connection Figures for the F3 overlay, which shows the same figures on screen without opening the menu.