Networking
Network Usage
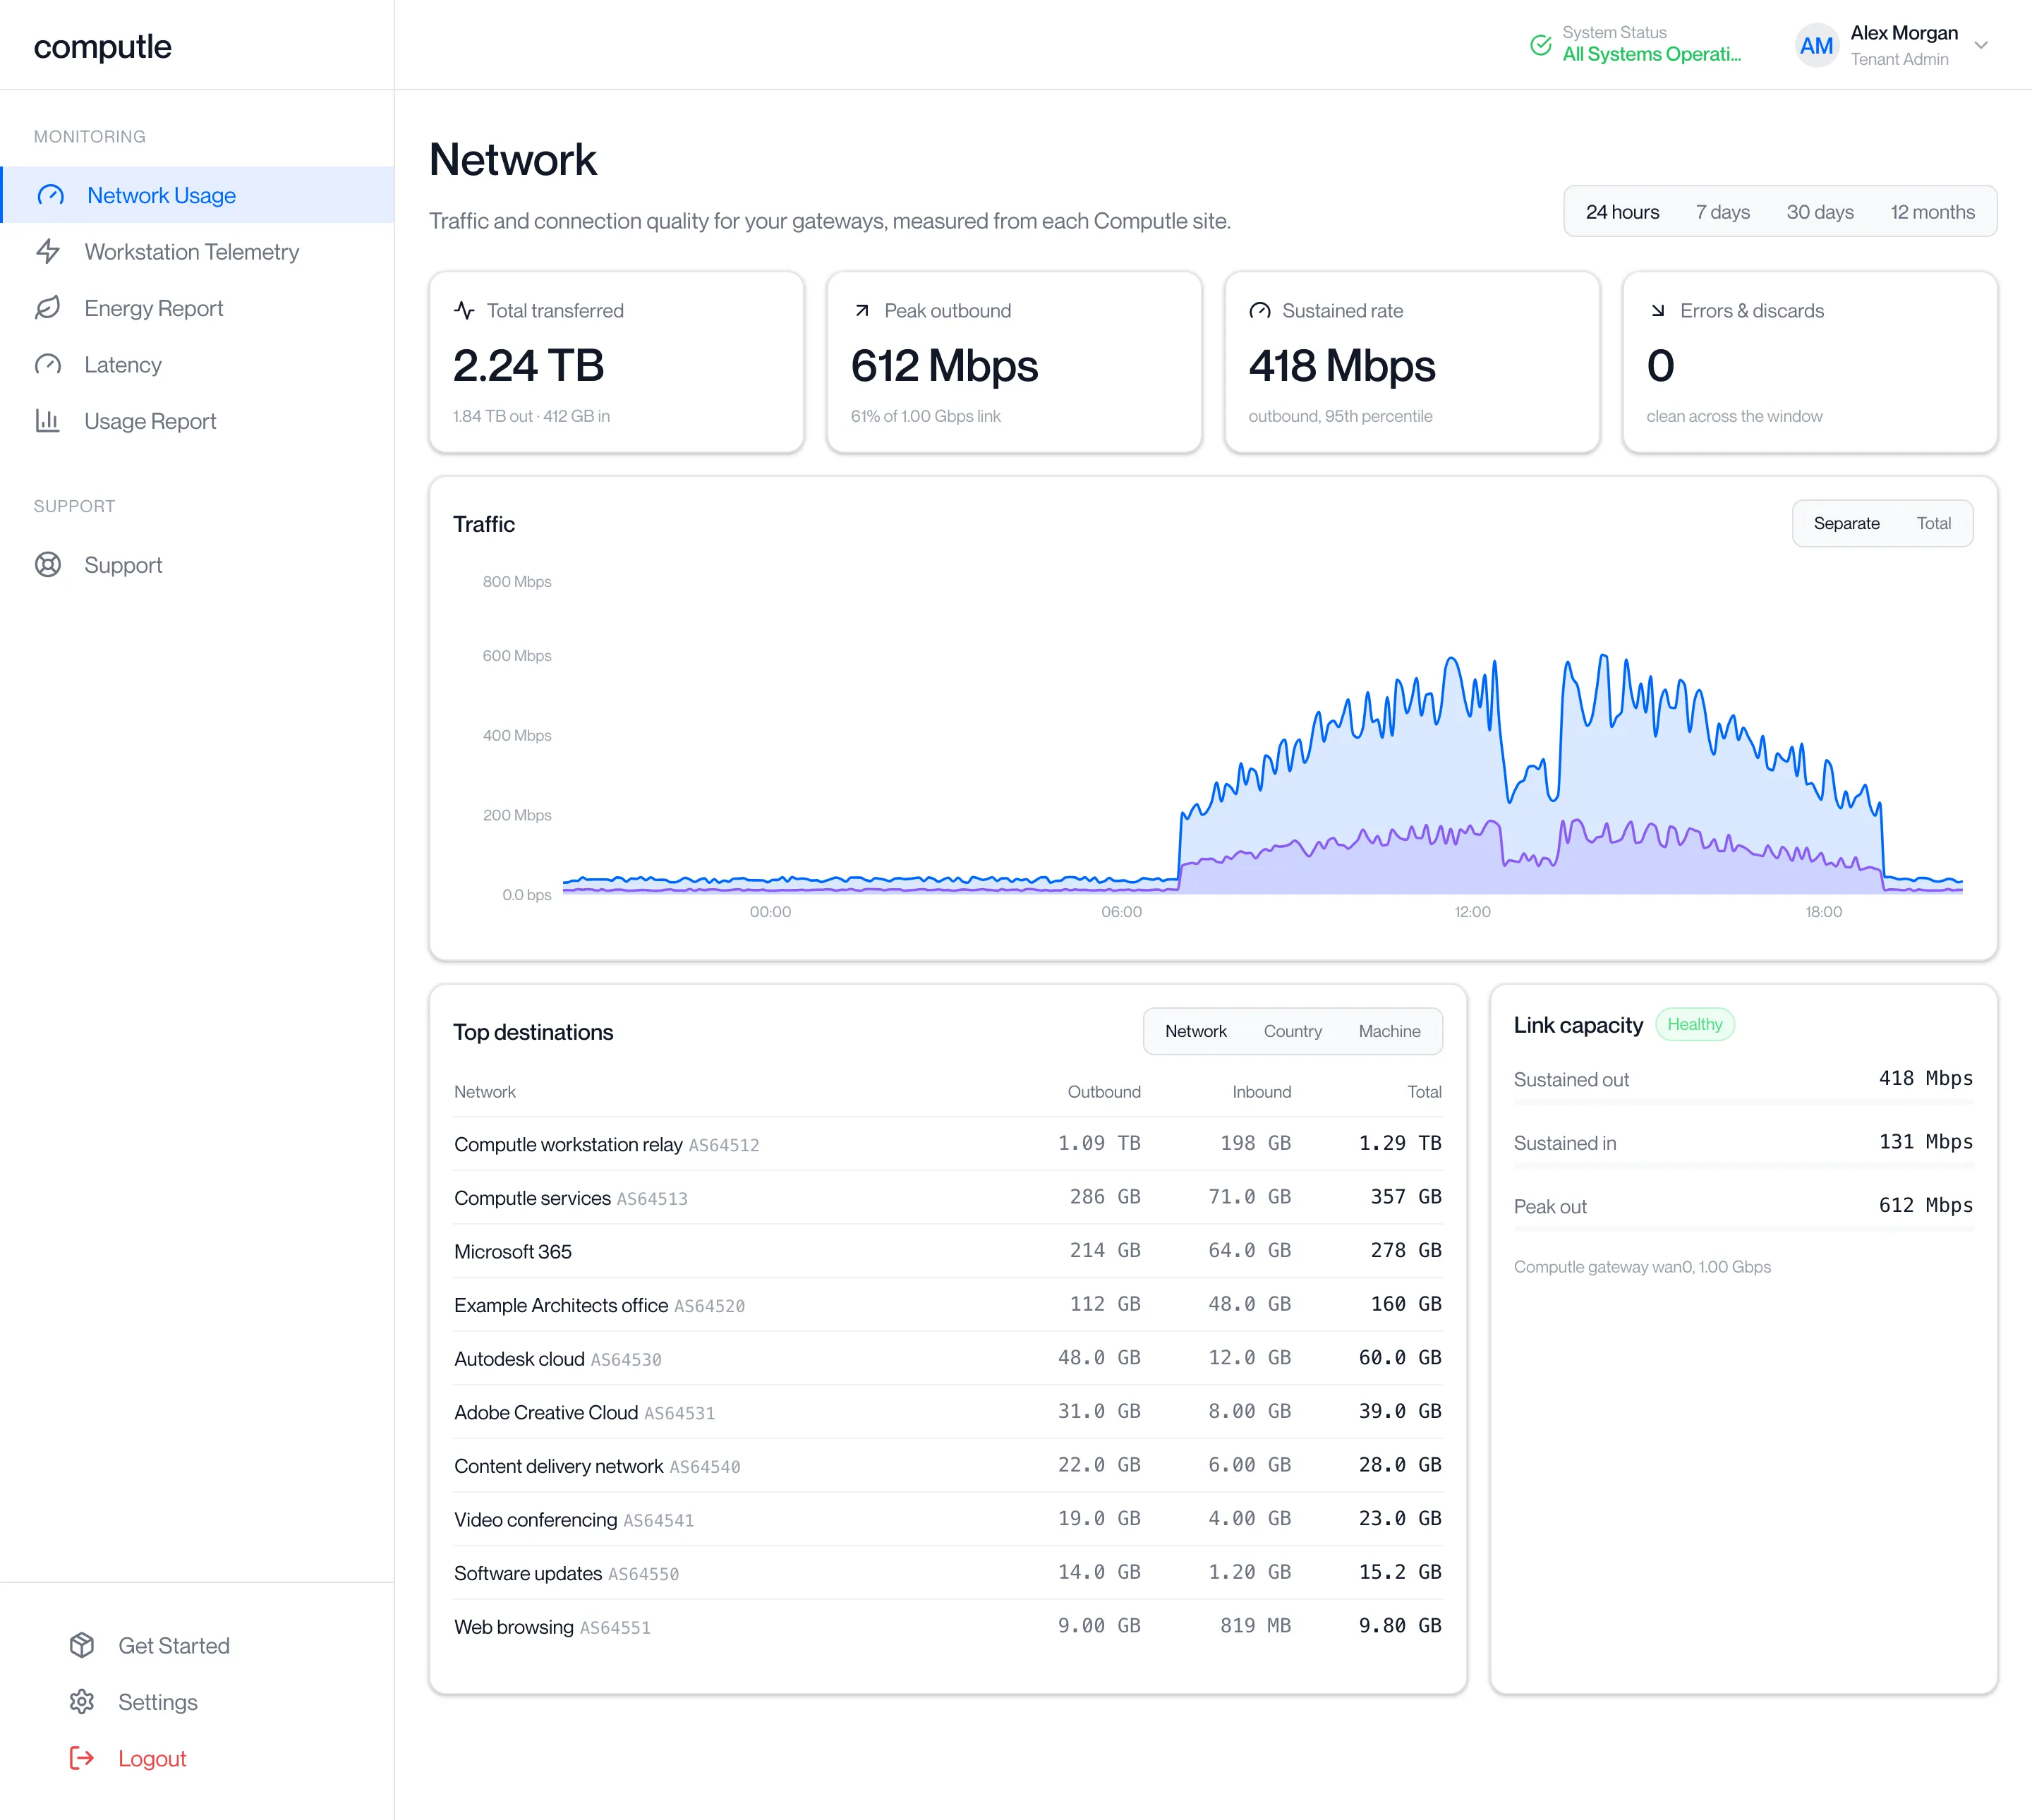
This page is for the IT administrator who wants to see what your Computle gateways are carrying and how well they reach the outside world. It covers Monitoring, Network Usage in the Computle Portal, headed Network on the page itself.
Computle switches the page on for your account. Until then it reads “This page is not enabled for your account.”
Before data arrives
Section titled “Before data arrives”Measurement starts when the page is switched on. Until the first traffic is recorded the page reads “Setting up your network monitoring: data usually appears within a few hours of activation”. Check back later; the page fills in on its own.
Controls
Section titled “Controls”| Control | Options |
|---|---|
| Site | All sites or one site. Shown only when your account spans more than one Computle site. Narrows the traffic panels; link capacity is always for every site. |
| Range | 24 hours, 7 days, 30 days, 12 months. Traffic is plotted in 5 minute points up to 2 days and hourly points beyond. |
Figures
Section titled “Figures”| Figure | Meaning |
|---|---|
| Total transferred | Bytes in both directions over the range, with out and in beneath. |
| Peak outbound | The highest outbound rate in the range, and what share of the link it was. |
| Sustained rate | The 95th percentile outbound rate: the rate exceeded only 5% of the time. |
| Errors & discards | Interface errors and discards over the range. clean across the window when zero; needs investigation otherwise. |
Sustained rate and Errors & discards read — with “not currently monitored” when interface statistics are not being collected for your gateway.
Traffic
Section titled “Traffic”The chart plots the gateway’s throughput over the range. Separate shows outbound and inbound as two areas; Total shows their sum. Move the pointer over the chart for the rates at a moment in time.
Top destinations
Section titled “Top destinations”A table of where the traffic went, ranked over the range. Click a column heading to sort by it; click again to reverse.
| View | Rows are |
|---|---|
| Network | The network operator the traffic went to or came from, with its number. |
| Country | The country the traffic went to or came from. |
| Machine | Your machines, outbound only. Inbound traffic reaches the gateway before address translation, so it cannot be attributed to a machine. |
Link capacity
Section titled “Link capacity”Three bars show Sustained out, Sustained in and Peak out against the link speed. The badge reads Healthy up to 80% and Approaching capacity above it. The panel reads not monitored when interface statistics are not collected.
Network quality
Section titled “Network quality”Round-trip time from each Computle site to each monitored target, probed once a minute. The range here is separate from the traffic range: 24 hours, 7 days or 30 days.
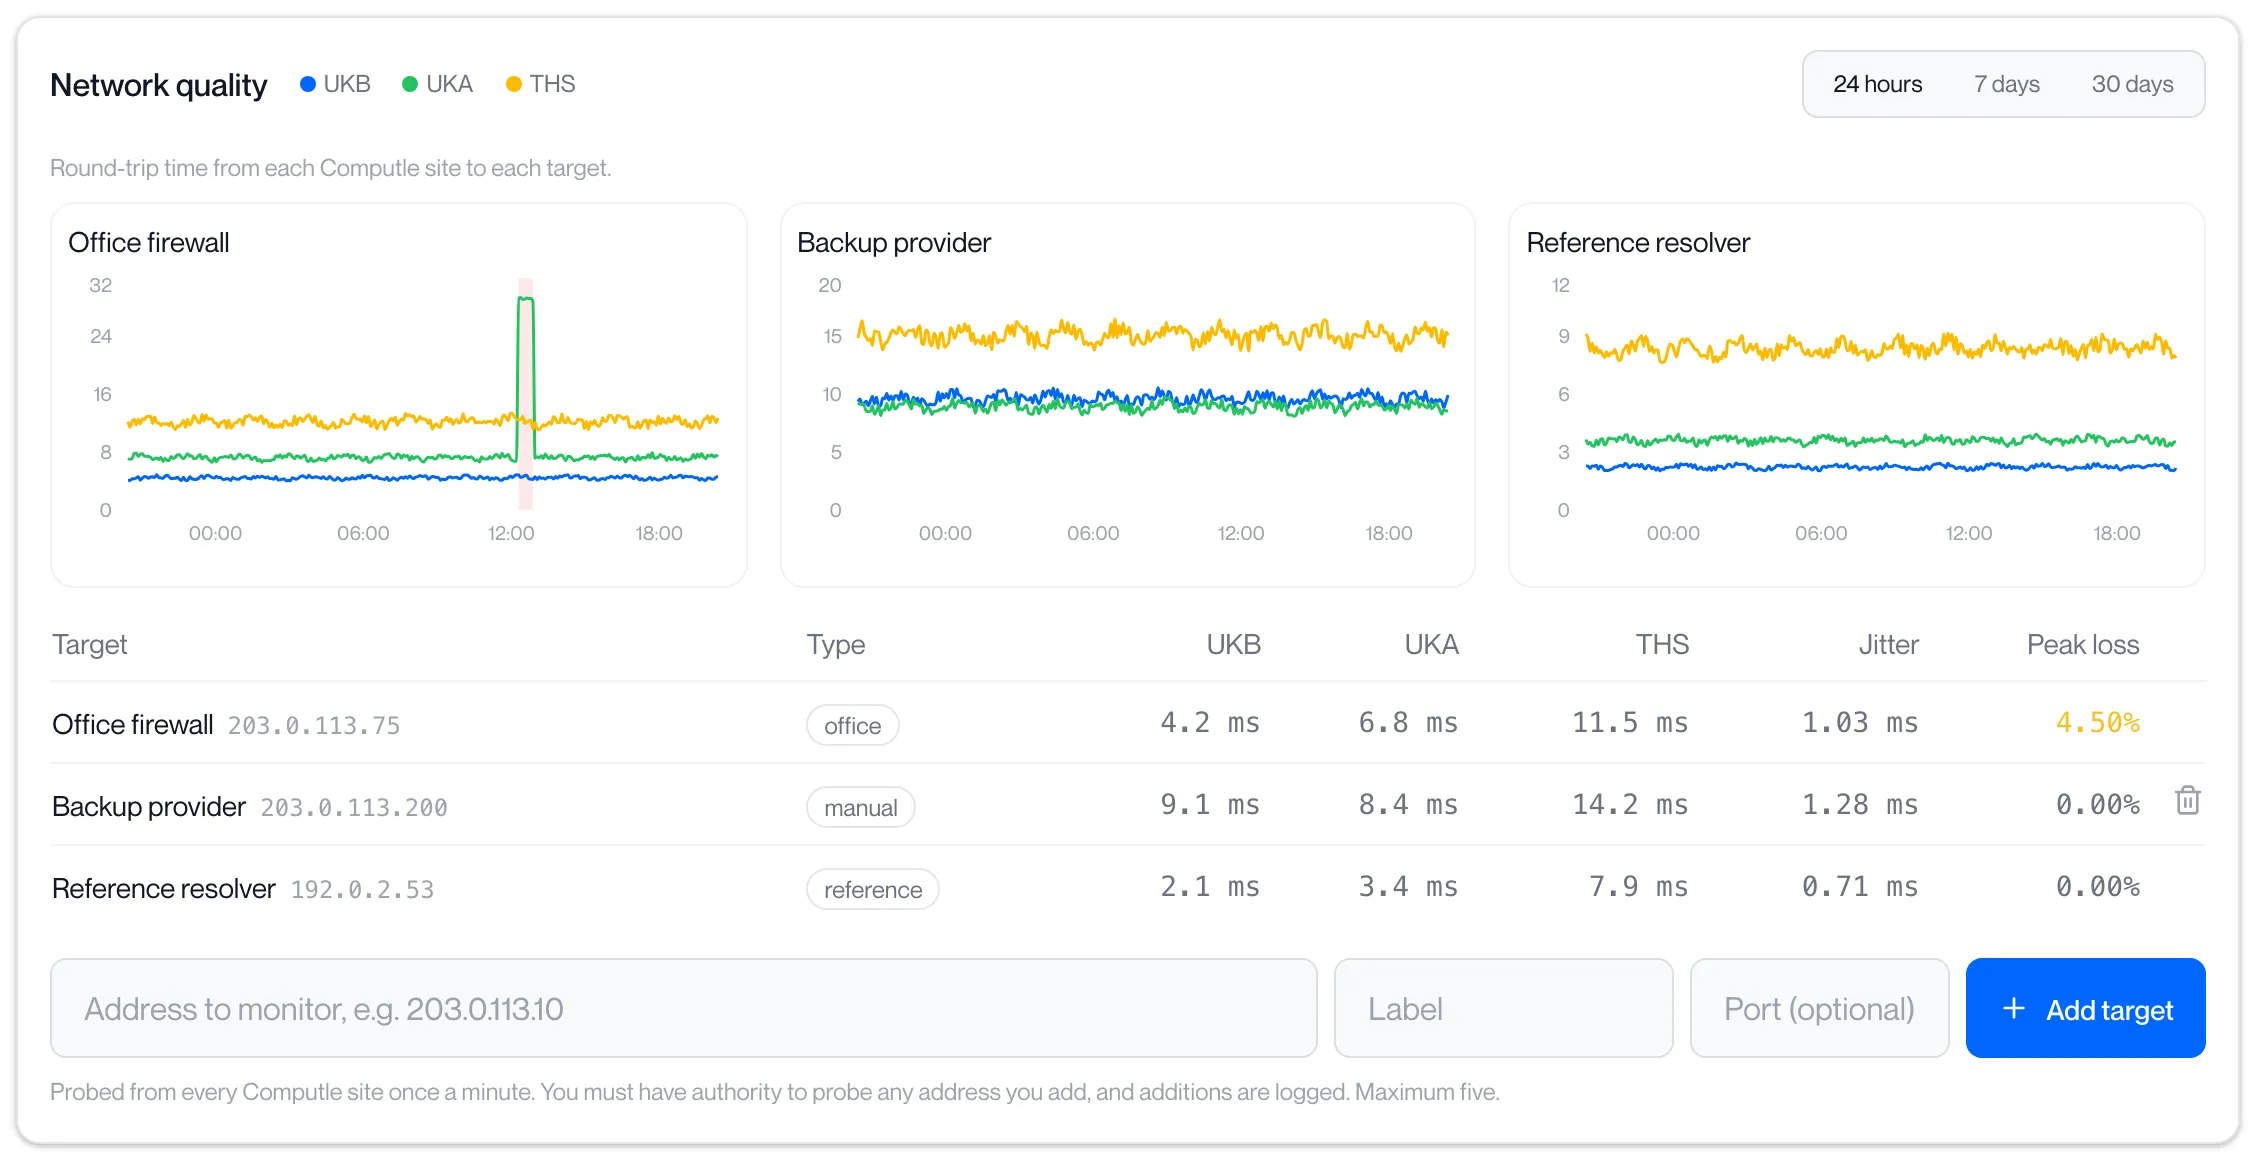
Each target has its own chart with one line per Computle site. A red band marks a period in which loss to that target exceeded 1% from a site.
The table beneath lists every target:
| Column | Meaning |
|---|---|
| Target | The label and the address. |
| Type | office, manual or reference, or a gateway kind for Computle’s own equipment. |
| One column per Computle site | Round-trip time from that site over the range. |
| Jitter | The largest variation in round-trip time seen from any site. |
| Peak loss | The highest loss seen from any site in the range. Amber above 1%. |
Filtered at target
Section titled “Filtered at target”When a target answers every Computle site but one, and that one sees nearly total loss, the table reads filtered · SITE and the chart reads filtered at target from SITE. The target’s own firewall is allowing some Computle addresses and dropping others. It is not counted as loss. Add the missing Computle site’s address to the allow list on that firewall.
Add a target
Section titled “Add a target”-
Enter the address, a label and, if you want a port test, the port.
Without a port the target is probed by ping. With a port it is probed by a TCP connection to that port.
-
Click Add target.
The new row appears with type
manual. The first readings arrive within a few minutes.
You may add up to five targets. You must have authority to probe any address you add, and each addition is logged. Click the bin icon on a manual row to remove it.