Site-to-site VPN
Traffic and throughput
This page is for the IT administrator checking what the tunnel is carrying. It covers the Traffic tab of Network, Site-to-site VPN in the Computle Portal.
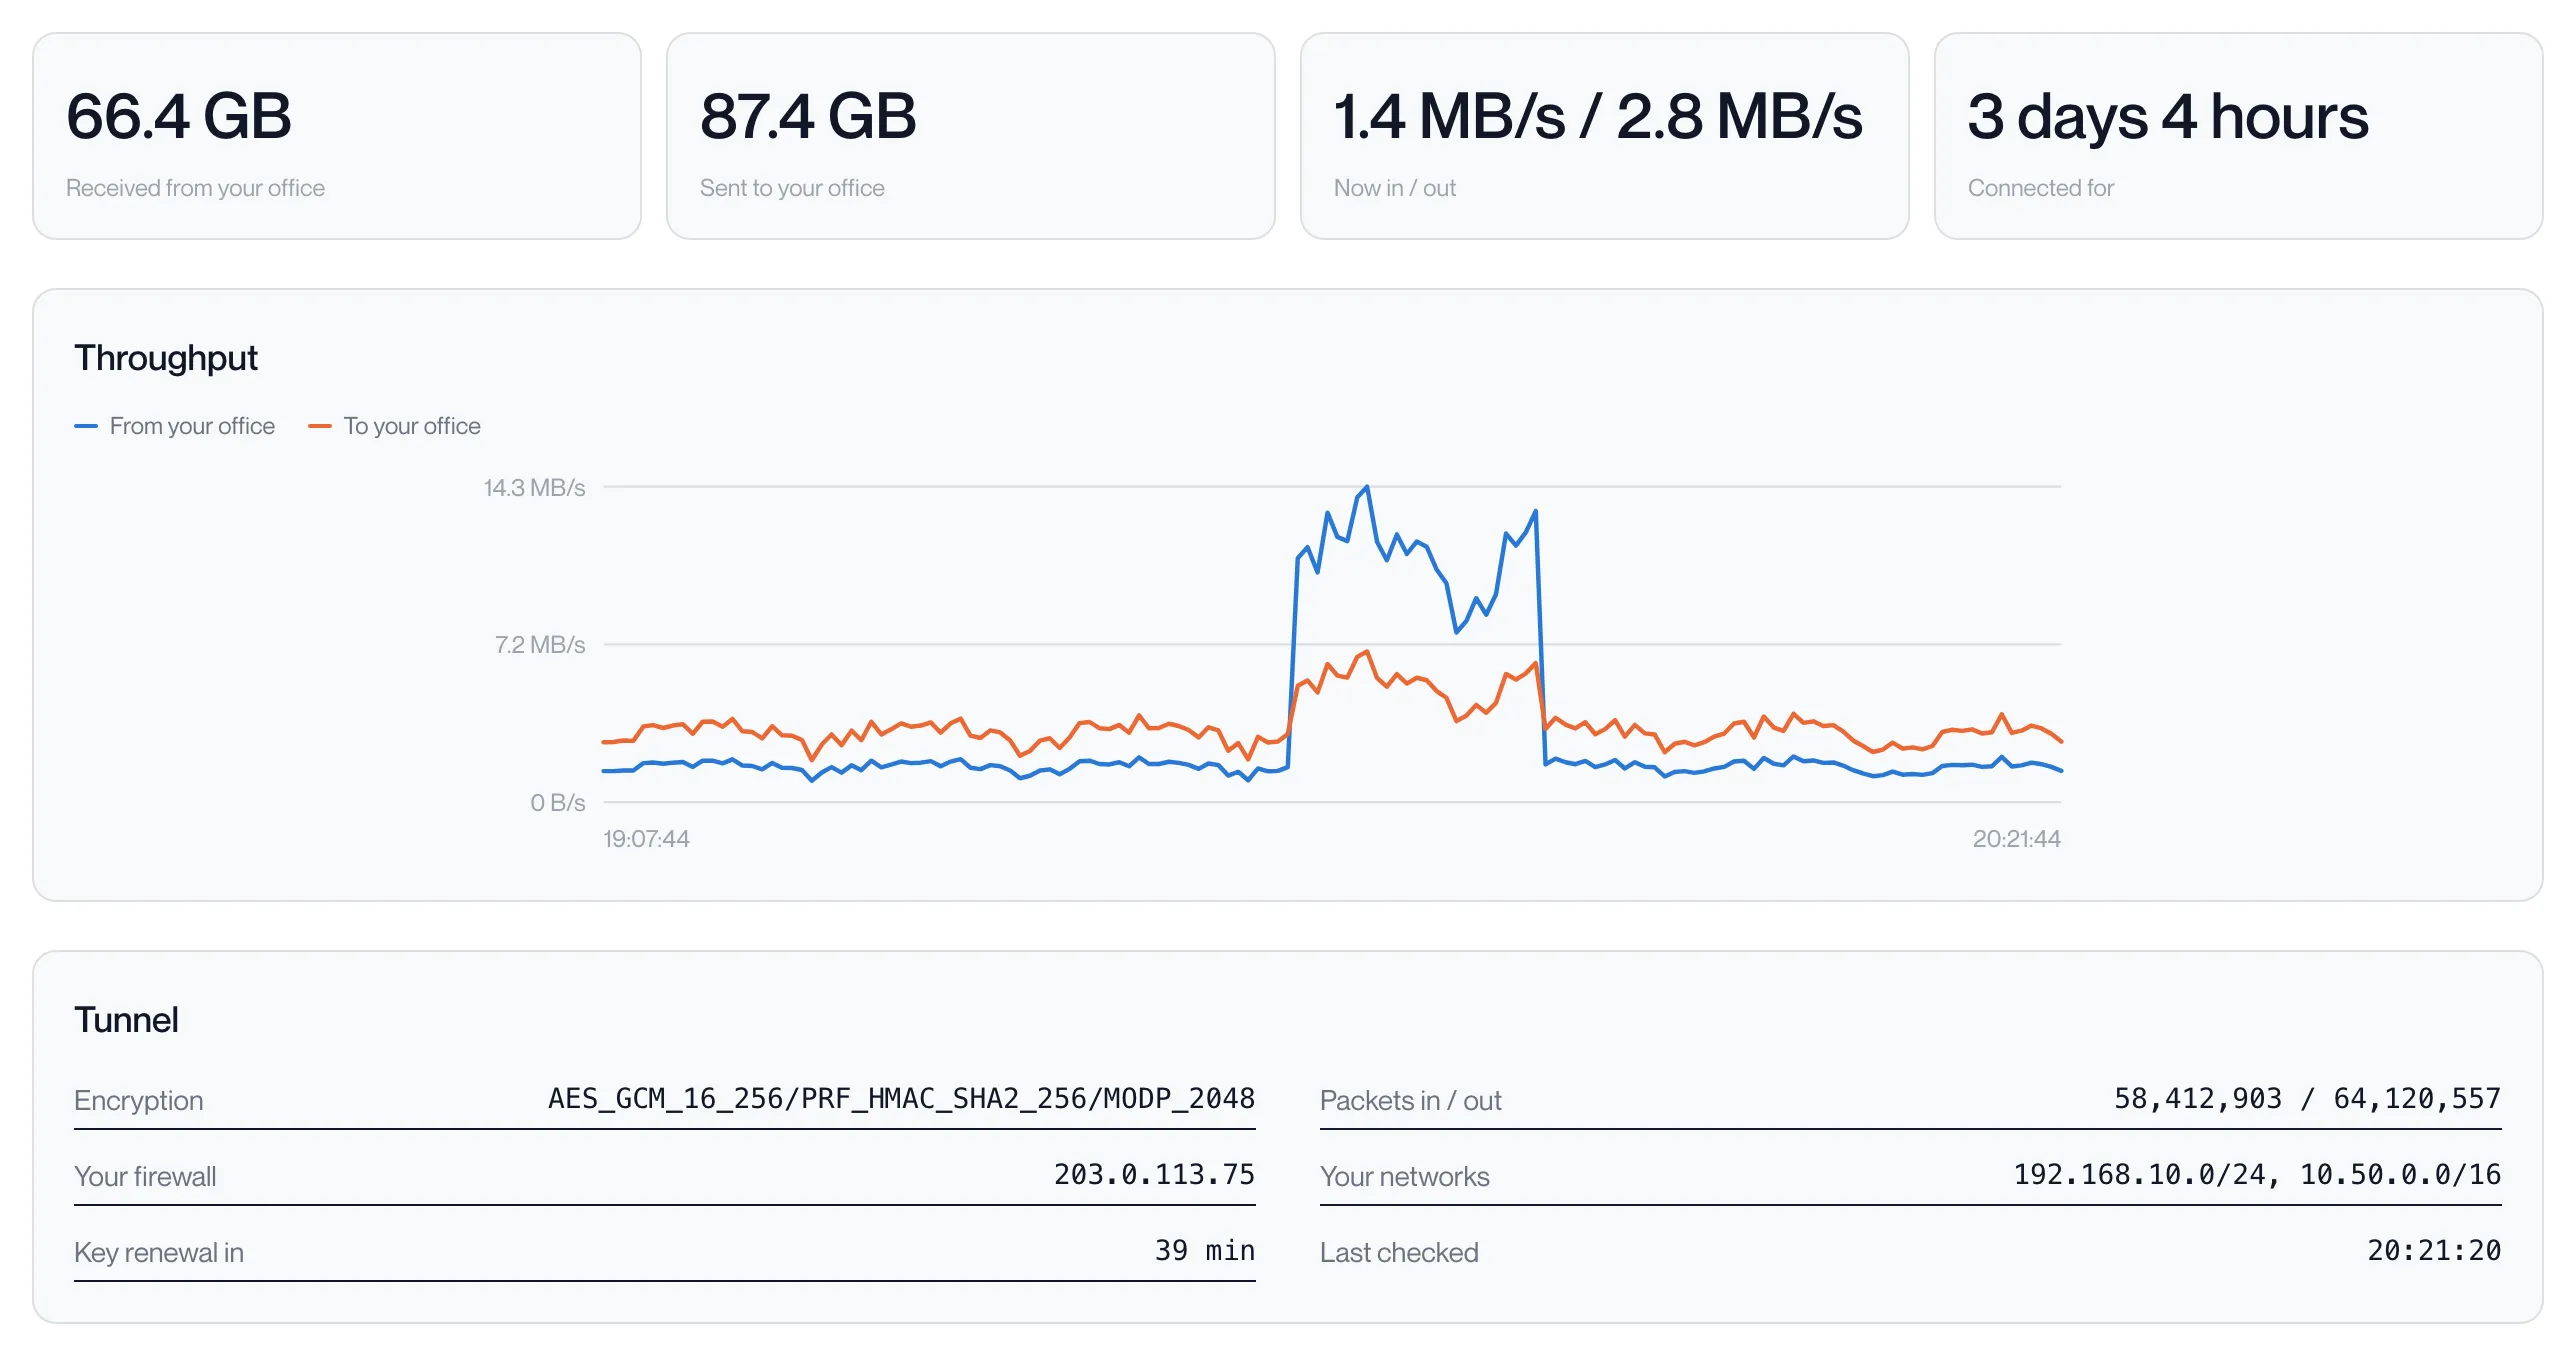
Everything on the tab is read from the gateway every 30 seconds. “Your office” means the far side of the tunnel; “in” is traffic arriving from your office, “out” is traffic leaving for your office.
Figures
Section titled “Figures”| Figure | Meaning |
|---|---|
| Received from your office | Bytes received through the tunnel since it last came up. |
| Sent to your office | Bytes sent through the tunnel since it last came up. |
| Now in / out | Throughput over the most recent 30 second interval, each way. |
| Connected for | How long the tunnel has been up. |
Throughput
Section titled “Throughput”The chart plots throughput over time, From your office in blue and To your office in orange. Move the pointer over the chart to read the two rates at a moment in time.
The chart is built from the gateway’s byte counters, sampled every 30 seconds while the tunnel is up. The last 240 samples are kept, so the chart covers about the last two hours. Until there are two samples the chart reads “Collecting data — the first readings appear within a minute.”
The counters restart when the tunnel renews its keys. The portal drops the interval in which that happens rather than plotting it as traffic, so an occasional gap in the lines is normal.
Tunnel
Section titled “Tunnel”| Row | Meaning |
|---|---|
| Encryption | The proposal your firewall and the gateway agreed on. |
| Packets in / out | Packet counters, each way, since the tunnel came up. |
| Your firewall | Your public IP address, as saved on the Connection tab. |
| Your networks | Your office networks, as saved on the Connection tab. |
| Key renewal in | Minutes until the tunnel’s keys are renewed. The Phase 2 lifetime is 3600 seconds. |
| Last checked | When the gateway last reported. |
A row reads — when the gateway has not reported that value yet.