Workstations
Workstation Telemetry
Workstation Telemetry shows what each workstation is drawing and doing: wall power, CPU and GPU power, temperatures, utilisation, memory, disk and network throughput, with a graph of each over the last hour to the last year, and a strip of its restarts over the past twelve months.
Open Workstation Telemetry in the Monitoring section of the portal sidebar. The entry appears only when telemetry is enabled for your organisation. The page needs the Tenant Admin role.
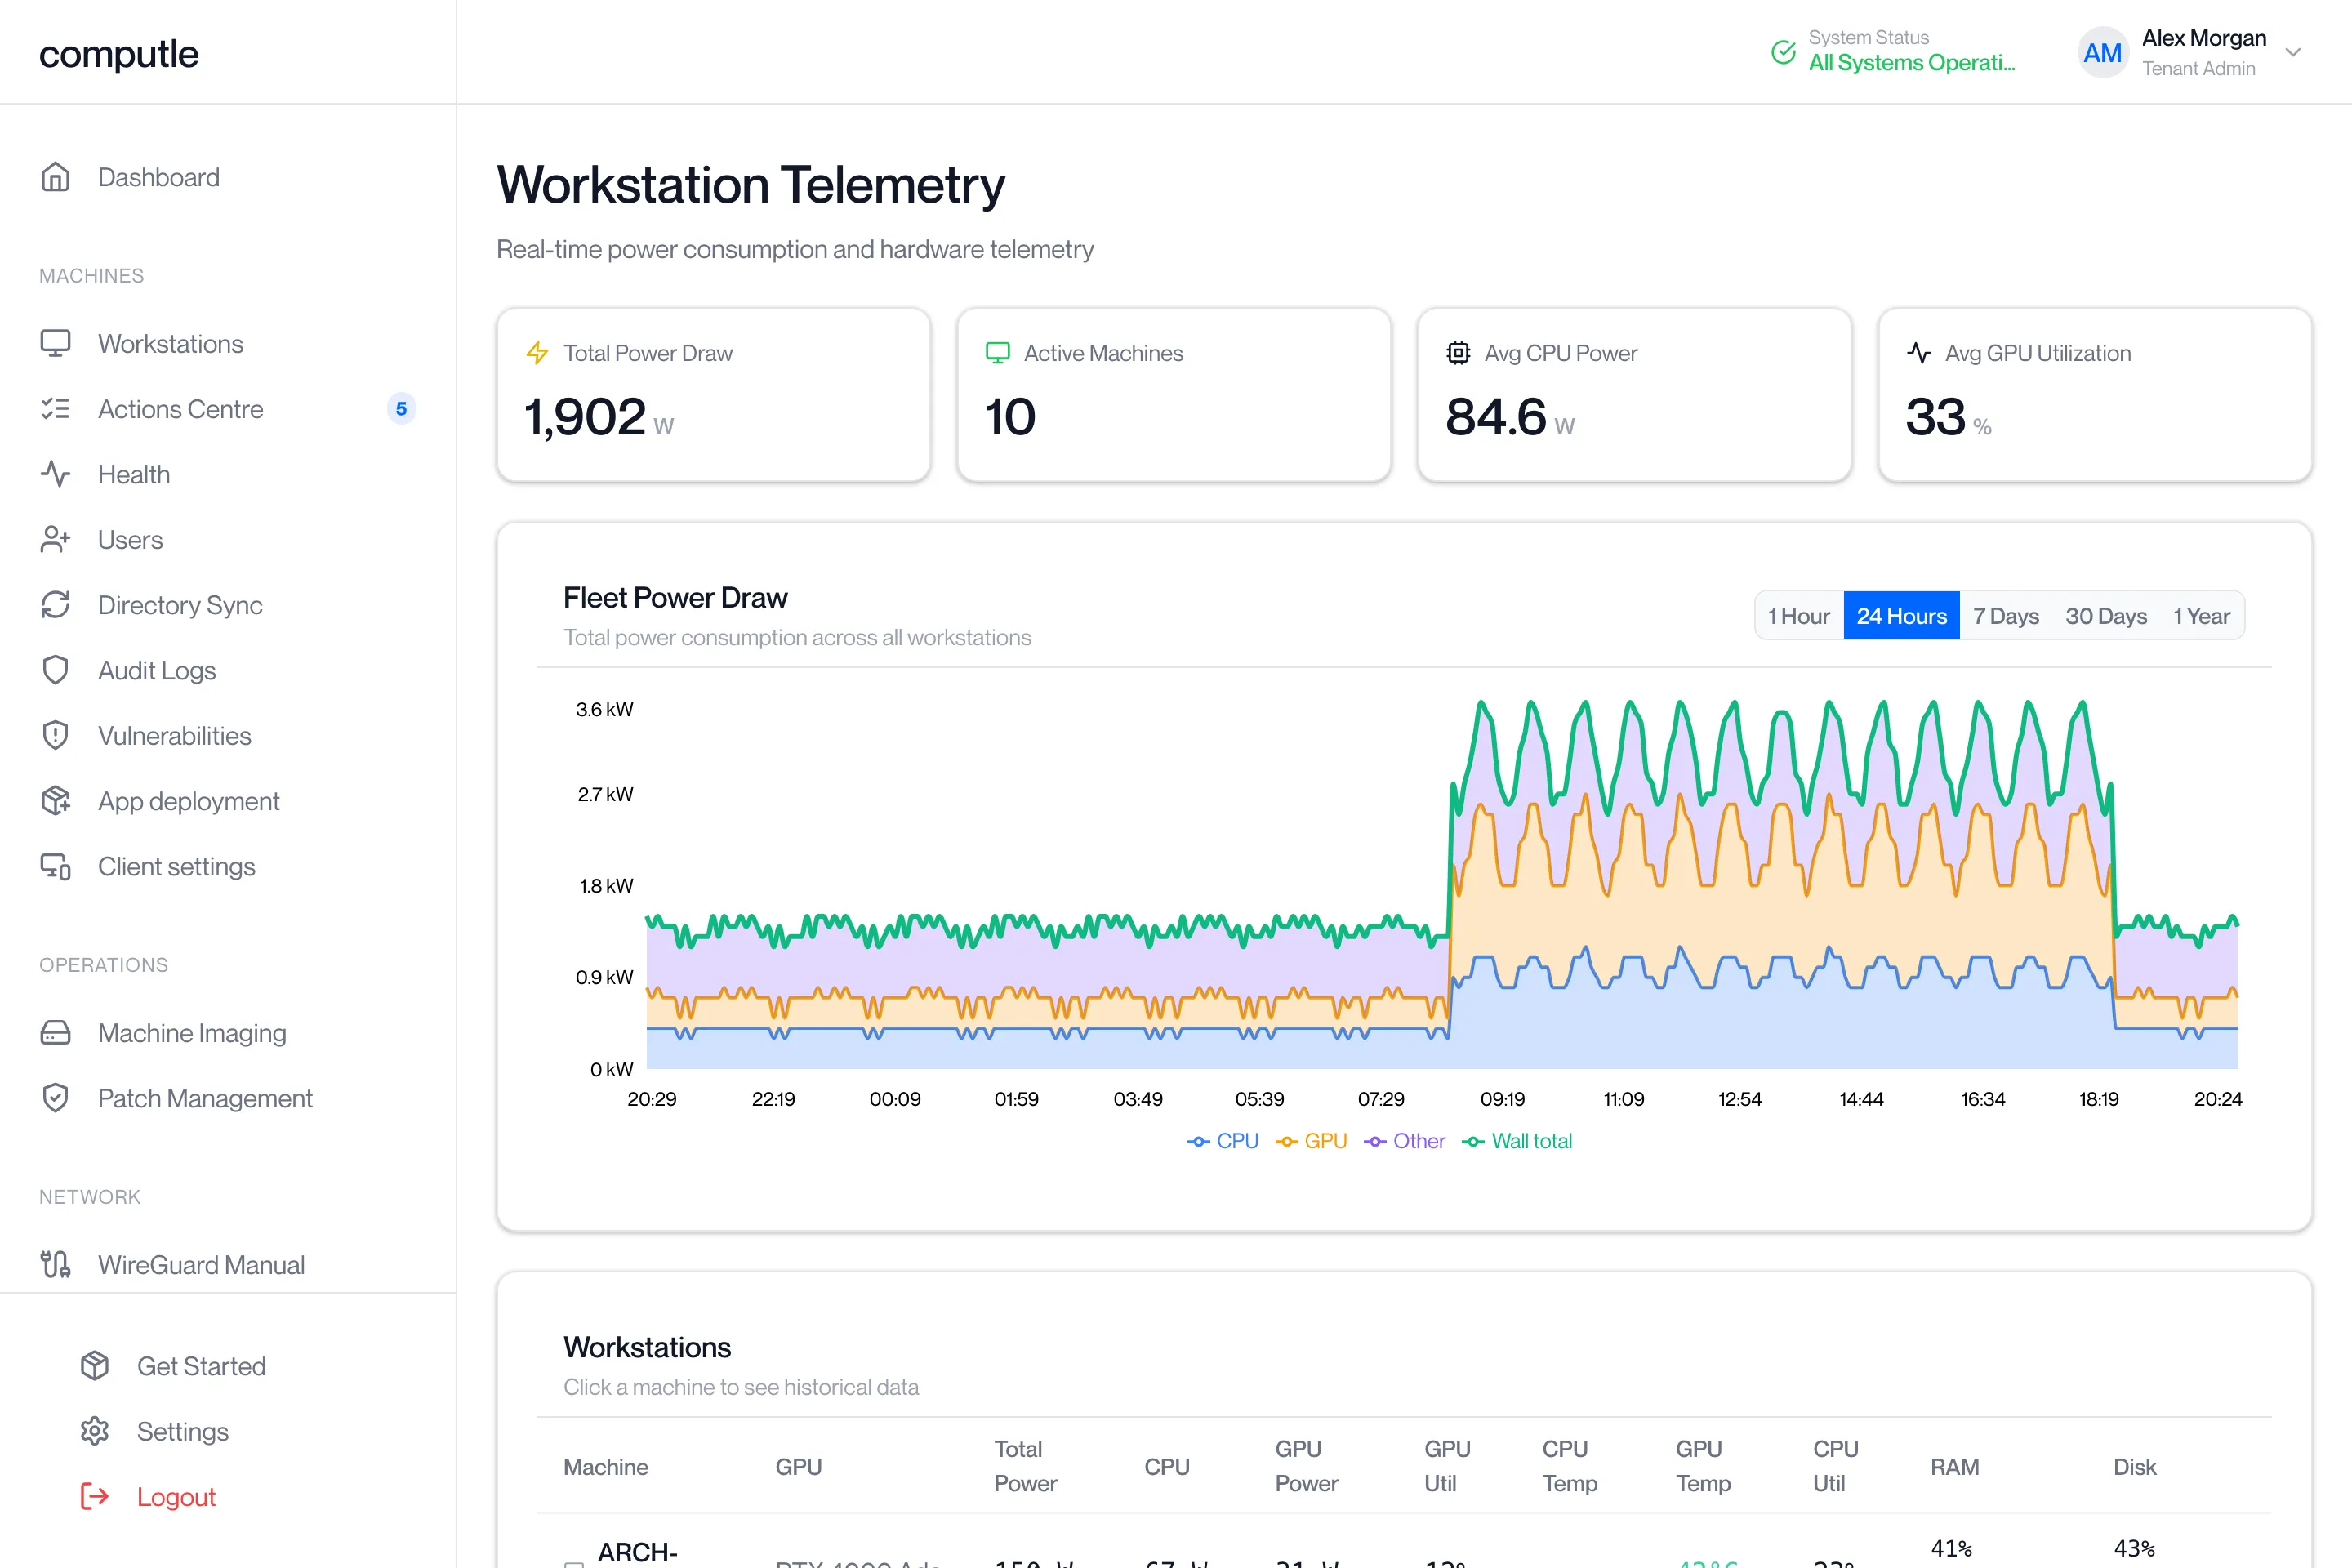
The figures come from the hardware each workstation runs on and are refreshed every 30 seconds. A workstation appears in the table while it has sent a reading in the last ten minutes.
Summary cards
Section titled “Summary cards”| Card | What it shows |
|---|---|
| Total Power Draw | The estimated wall power of every workstation in the table, in watts. |
| Active Machines | The number of workstations that have sent a reading in the last ten minutes. |
| Avg CPU Power | The mean CPU package power across those workstations, in watts. |
| Avg GPU Utilization | The mean GPU use across those workstations, as a percentage. |
Wall power is an estimate: the measured CPU, GPU, memory and uncore figures, plus a fixed allowance for the board, memory, storage and cooling, divided by a power supply efficiency.
Fleet Power Draw
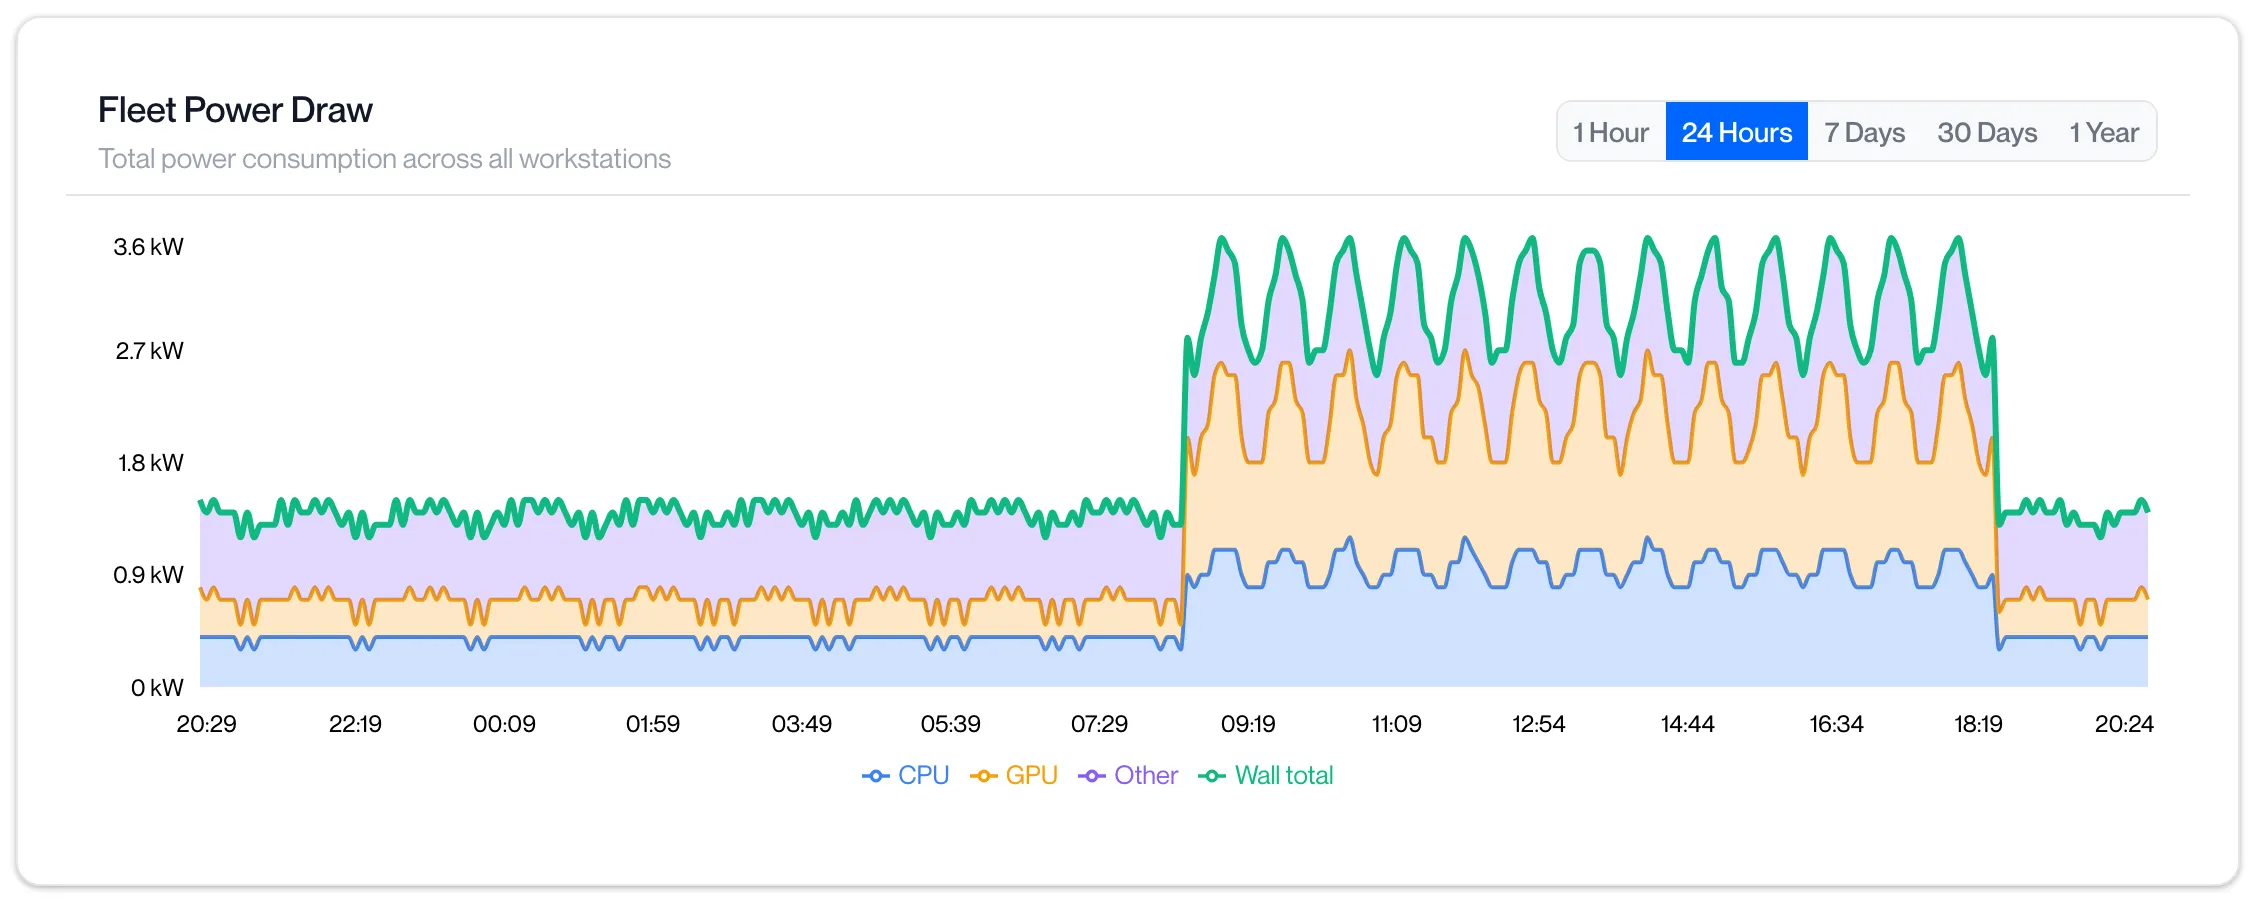
Section titled “Fleet Power Draw”The graph stacks CPU, GPU and Other power for the whole organisation, in kilowatts, with a Wall total line over them. Other is the part of the wall total that is not CPU or GPU.
Choose the period with the buttons at the top right: 1 Hour, 24 Hours, 7 Days, 30 Days or 1 Year. The graph opens on 24 Hours. Hover over the graph to read the values at a point in time.
The workstation table
Section titled “The workstation table”The Workstations table lists every workstation with a current reading, in name order. On a narrow screen the same figures appear as cards.
| Column | What it shows |
|---|---|
| Machine | The workstation’s name. A workstation the portal cannot name shows the first eight characters of its ID. |
| GPU | The graphics card model. |
| Total Power | Estimated wall power, in watts. |
| CPU | CPU package power, in watts. |
| GPU Power | GPU power, in watts. |
| GPU Util | GPU use, as a percentage. |
| CPU Temp | CPU temperature, in °C. |
| GPU Temp | GPU temperature, in °C. |
| CPU Util | Processor use, as a percentage. |
| RAM | Memory in use as a percentage, with a bar and the figures in GB. |
| Disk | Disk space in use as a percentage, with a bar and the figures in GB. |
A dash means the workstation has not reported that figure.
Temperatures are coloured green below 60 °C, yellow from 60 °C, orange from 75 °C and red from 90 °C. The RAM and Disk bars turn yellow at 70% and red at 90%.
If no workstation has reported, the table reads “No telemetry data yet. Deploy agents to hypervisors to start collecting.” Telemetry is set up by Computle; contact your account manager.
One workstation’s history
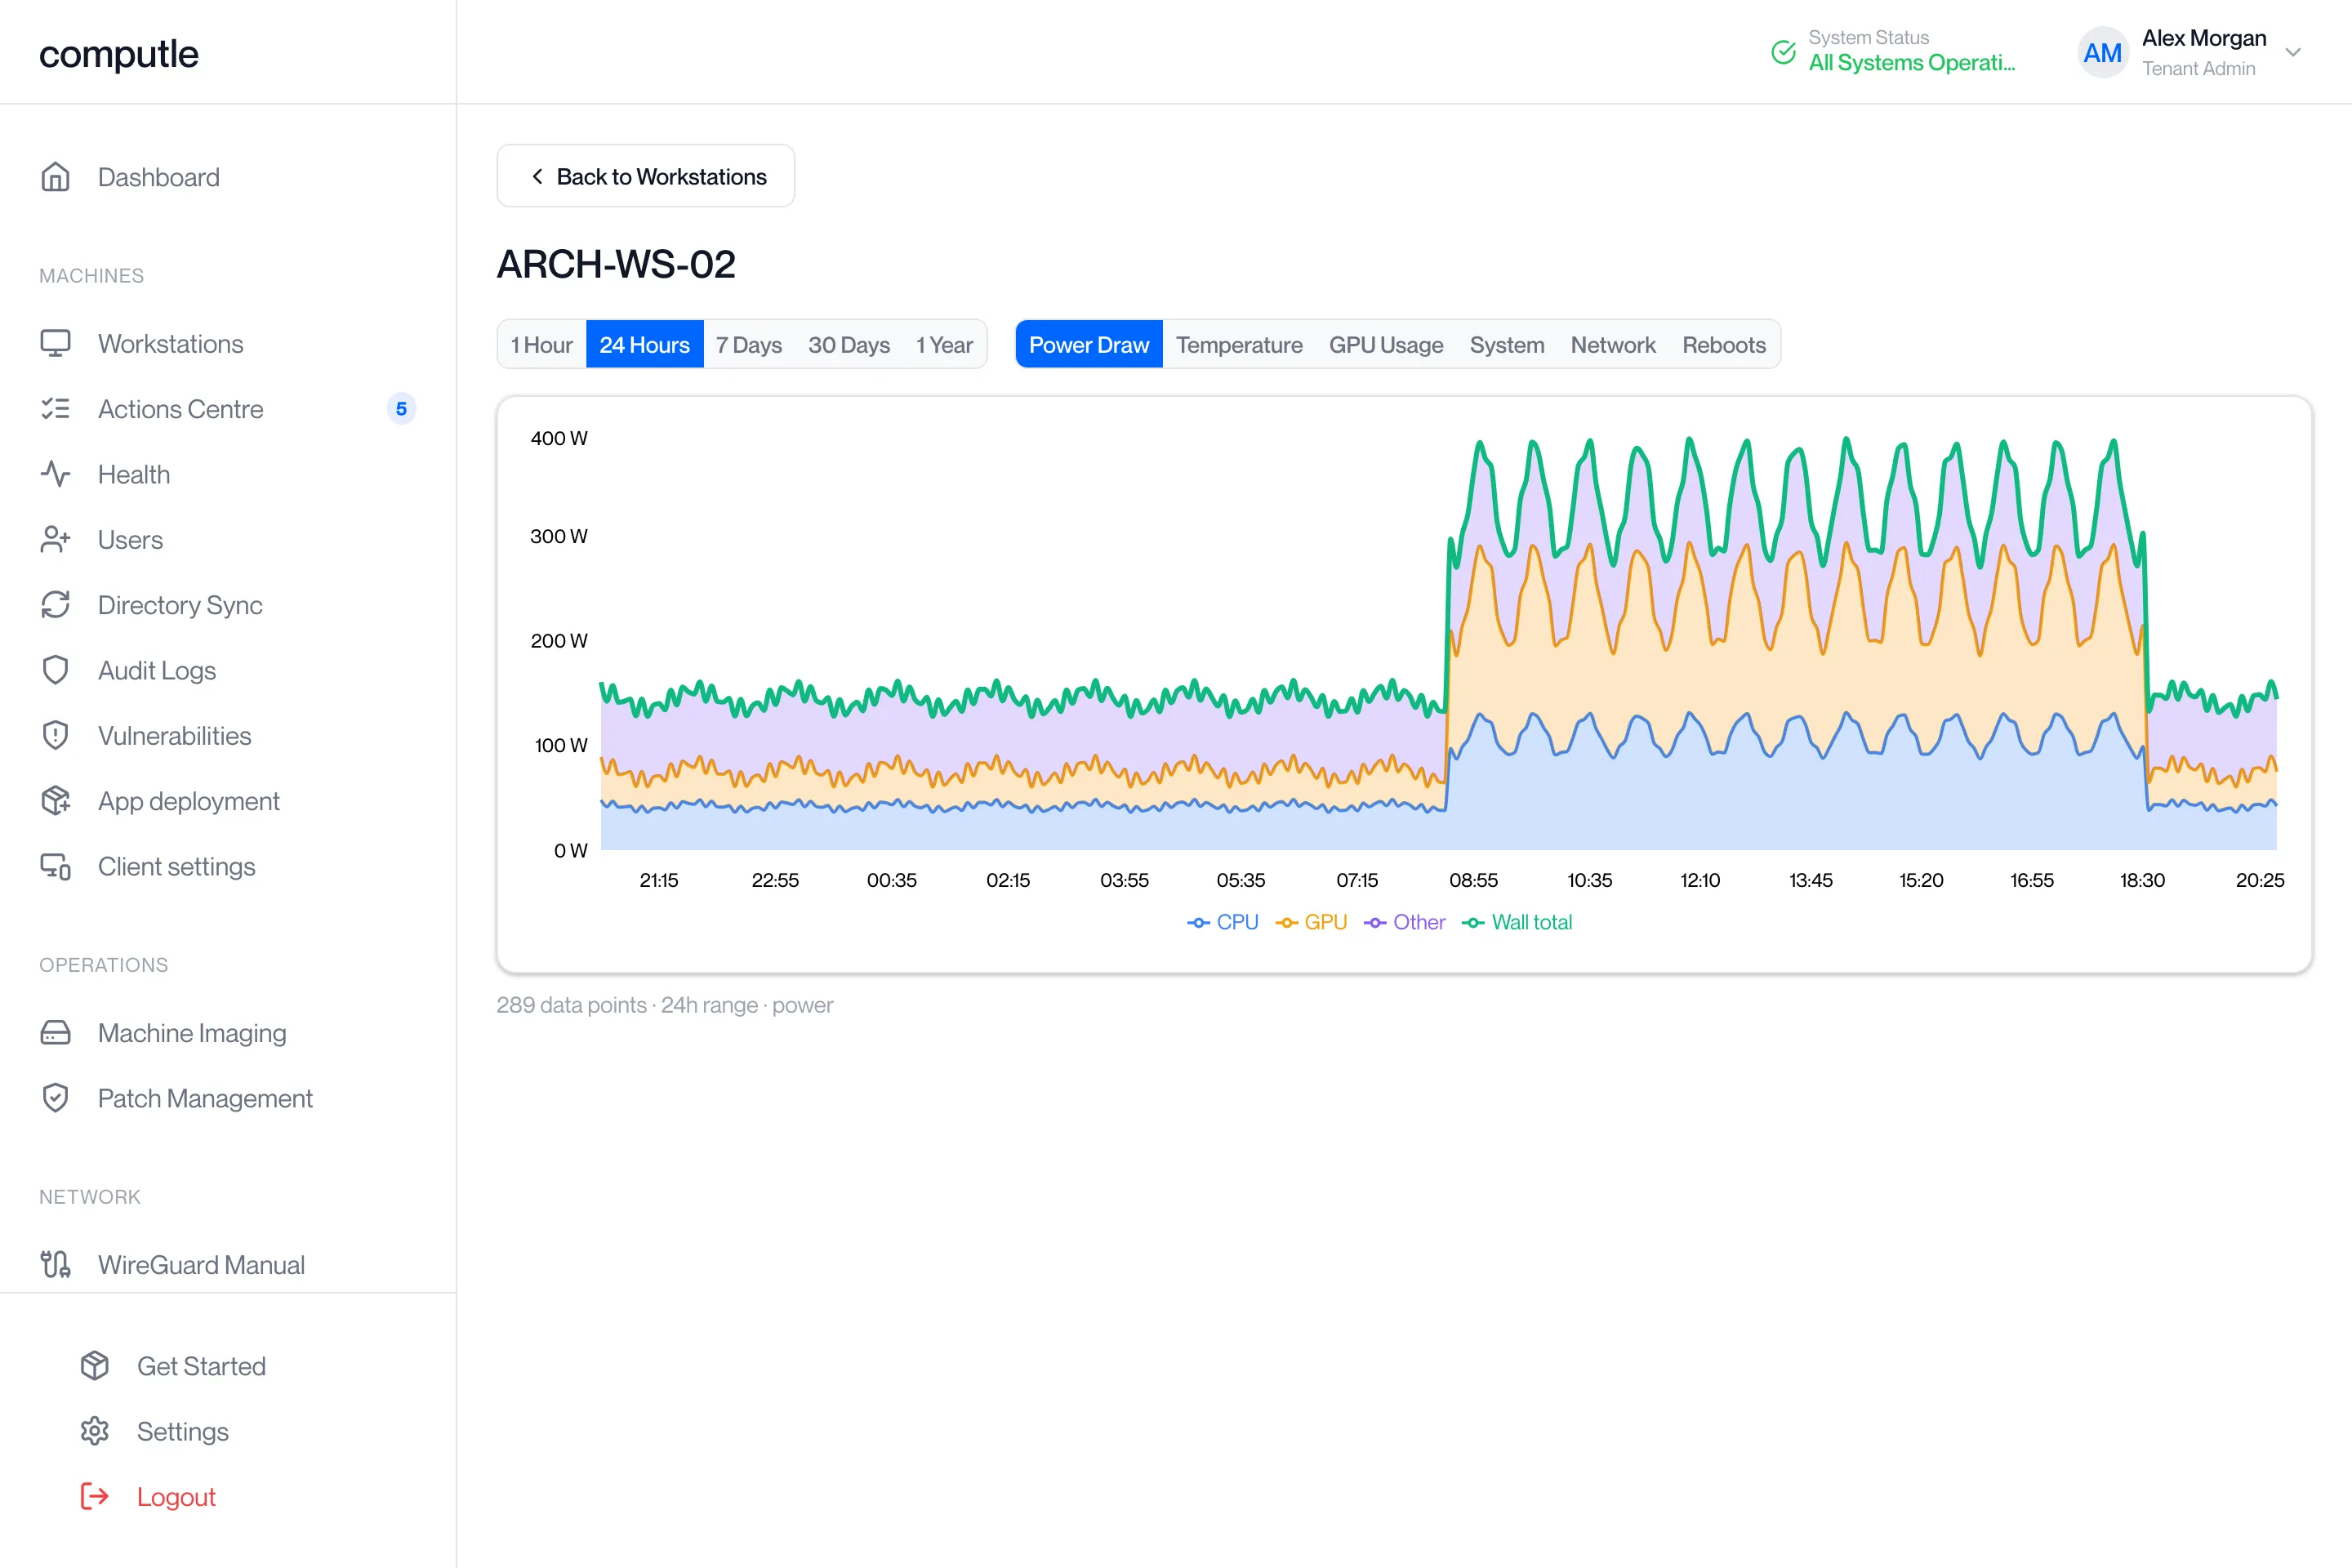
Section titled “One workstation’s history”Click a workstation in the table to open its history. The page also opens here from the View telemetry history link in a workstation’s details panel on the Workstations page, and from the resource tiles on the Health page. Click Back to Workstations to return to the table; the browser’s back button does the same.
Period
Section titled “Period”1 Hour, 24 Hours, 7 Days, 30 Days or 1 Year. The graph opens on 24 Hours. The 1 Hour graph refreshes every 30 seconds; the others every minute. Each period plots the whole span, so a gap in the line is a time with no reading.
| Period | One point every |
|---|---|
| 1 Hour | 30 seconds |
| 24 Hours | 5 minutes |
| 7 Days | 30 minutes |
| 30 Days | 2 hours |
| 1 Year | 1 day |
Metrics
Section titled “Metrics”| Metric | Graph |
|---|---|
| Power Draw | CPU, GPU and Other power stacked in watts, with a Wall total line. |
| Temperature | CPU Temp and GPU Temp in °C. |
| GPU Usage | GPU Util and VRAM as percentages. |
| System | CPU, RAM and Disk use as percentages. |
| Network | Down and Up throughput in Mbps. |
| Reboots | The reboot strip. See below. The period buttons do not apply. |
Under the graph, “N data points · range · metric” states how many readings the graph is drawn from.
Reboots
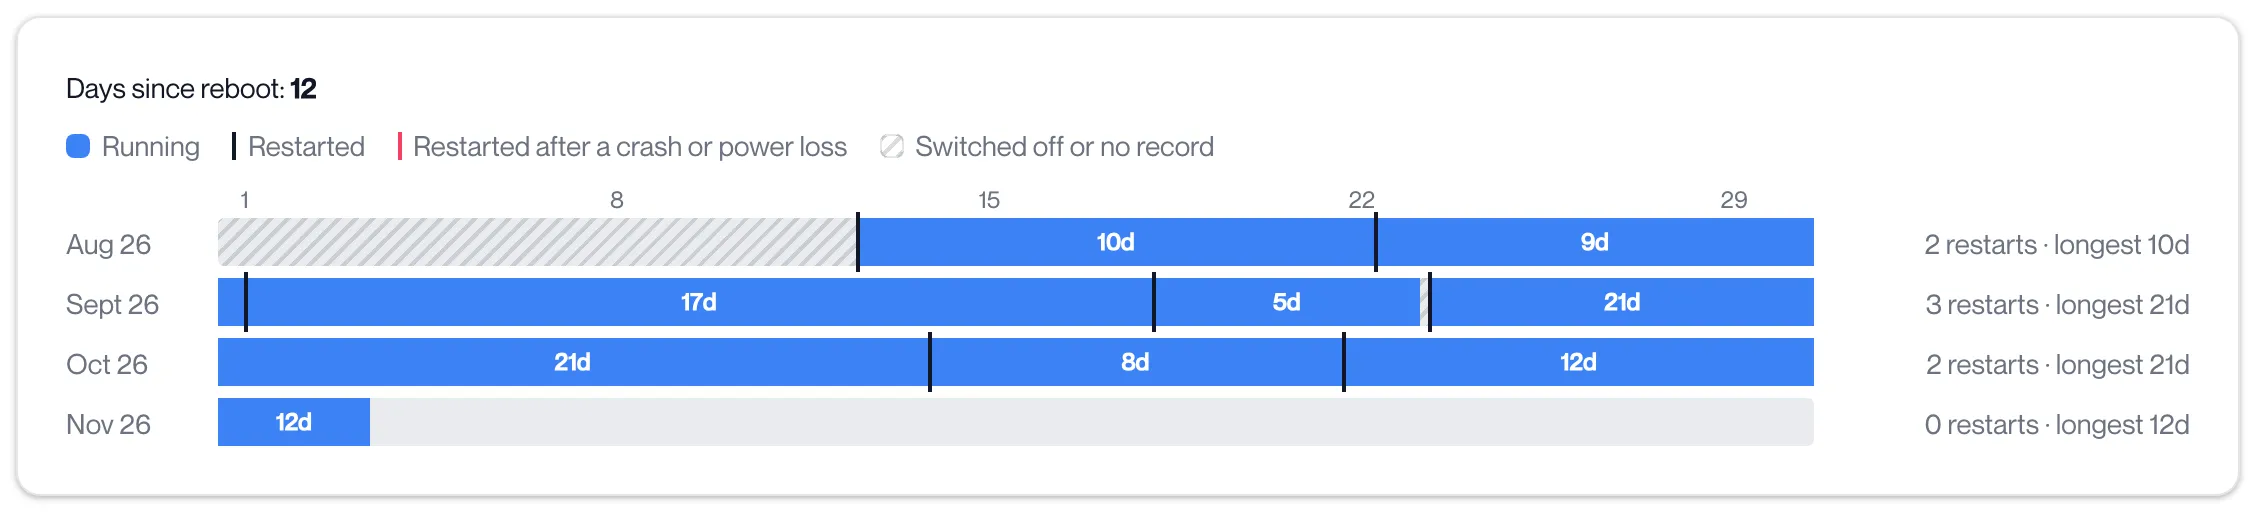
Section titled “Reboots”The Reboots view shows “Days since reboot” and one row per month for up to twelve months, each marking the runs between restarts.
| Mark | Meaning |
|---|---|
| Blue bar | Running. The bar is labelled with the length of the run, and hovering shows when it started and ended. |
| Dark line | Restarted. |
| Red line | Restarted after a crash or power loss: the run before it did not end with a shutdown. |
| Hatched area | Switched off, or before the workstation’s record begins. |
Each row ends with the number of restarts in that month and the longest run. A run that crosses a month end continues on the next row. Two restarts within an hour of each other, as Windows Update often does, count as one.
“Days since reboot” is whole days since Windows last started. It reads “not running” when the workstation has not reported for 15 minutes, and “No reboot history reported yet.” when no run has been recorded. The same strip appears under “Time between reboots” in the workstation’s details panel on the Workstations page.
Related pages
Section titled “Related pages”Questions
Section titled “Questions”A workstation is missing from the table. Why?
Section titled “A workstation is missing from the table. Why?”The table lists workstations that have sent a reading in the last ten minutes. A workstation that is off, or whose host has stopped reporting, drops out of the table and returns when readings resume. Its history is still there: open it from the Workstations or Health page.
Why does Total Power not equal CPU plus GPU?
Section titled “Why does Total Power not equal CPU plus GPU?”Total Power is estimated wall power. It includes memory, uncore and a fixed allowance for the rest of the machine, divided by the power supply efficiency. The Power Draw graph shows that difference as Other.
The graph shows “No data available”. What does it mean?
Section titled “The graph shows “No data available”. What does it mean?”No reading was recorded for that workstation in the chosen period. Try a longer period.
A machine shows a red restart line but nobody reported a crash. What happened?
Section titled “A machine shows a red restart line but nobody reported a crash. What happened?”The workstation started without a shutdown being recorded before it: a crash, a power cut, or a forced power-off. The Health page shows whether a crash dump arrived for it.